NZD/USD Price Analysis: Pulls back from 200-SMA despite firmer China GDP
- NZD/USD retreats from two-week high even as China Q3 GDP grew better than forecast.
- MACD signals, rebound from one-week-old rising trend line favor buyers.
- One-month-old horizontal resistance acts as extra filters to the north.
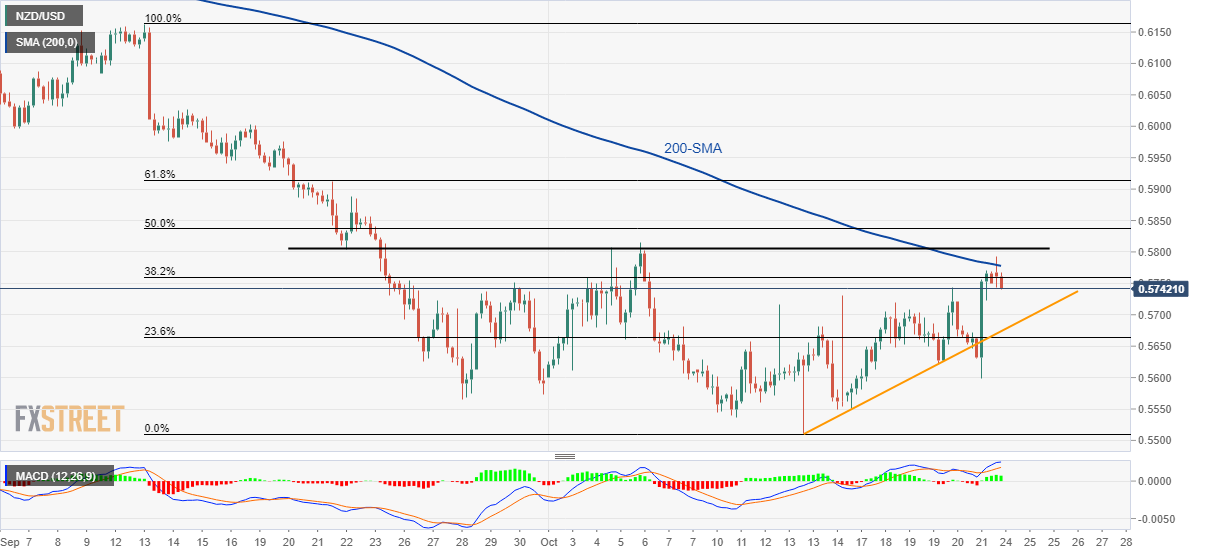
NZD/USD fails to justify upbeat China data as it drops to 0.5745 while extending the week-start pullback from the 12-day high during Monday’s Asian session.
Also read: China GDP (YoY) Q3: 3.9% (exp 3.3% vs. prev 0.4%), Aussie remains volatile
In doing so, the Kiwi pair retreats from the 200-SMA and ignores the bullish MACD signals.
With this, the quote’s further downside becomes questionable unless it breaks the one-week-old support line, around 0.5675 by the press time.
Following that, a downward trajectory towards refreshing the yearly low near 0.5510 can’t be ruled out.
It should be noted that the NZD/USD pair’s weakness past 0.5510 needs validation from the 0.5500 threshold and the year 2020 bottom surrounding 0.5470 to keep the bears on the table.
Alternatively, recovery moves will initially need to cross the 200-SMA hurdle near 0.5780 to convince intraday buyers before challenging a one-month-old horizontal resistance area surrounding 0.5805-10.
Should the Kiwi pair buyers manage to keep the reins past 0.5810, the quote can aim for the 0.6000 psychological magnet and the previous monthly peak surrounding 0.6165.
NZD/USD: Four-hour chart

Trend: Limited downside expected
