AUD/JPY Price Analysis: Conquers the 20-day EMA as a double bottom, looms
- AUD/JPY climbs above the 20-day EMA, eyeing a break of 93.00.
- Double bottom in the daily chart targets a test of the YTD high around 98.60.
The AUD/JPY prolonged its gains to seven straight days amidst a risk-on impulse that benefitted high-beta currencies, while safe-haven ones remain downward pressured, except for the US Dollar (USD), bolstered by a looming US CPI report. At the time of writing, the AUD/JPY is trading at 92.81.
AUD/JPY Price Analysis: Technical outlook
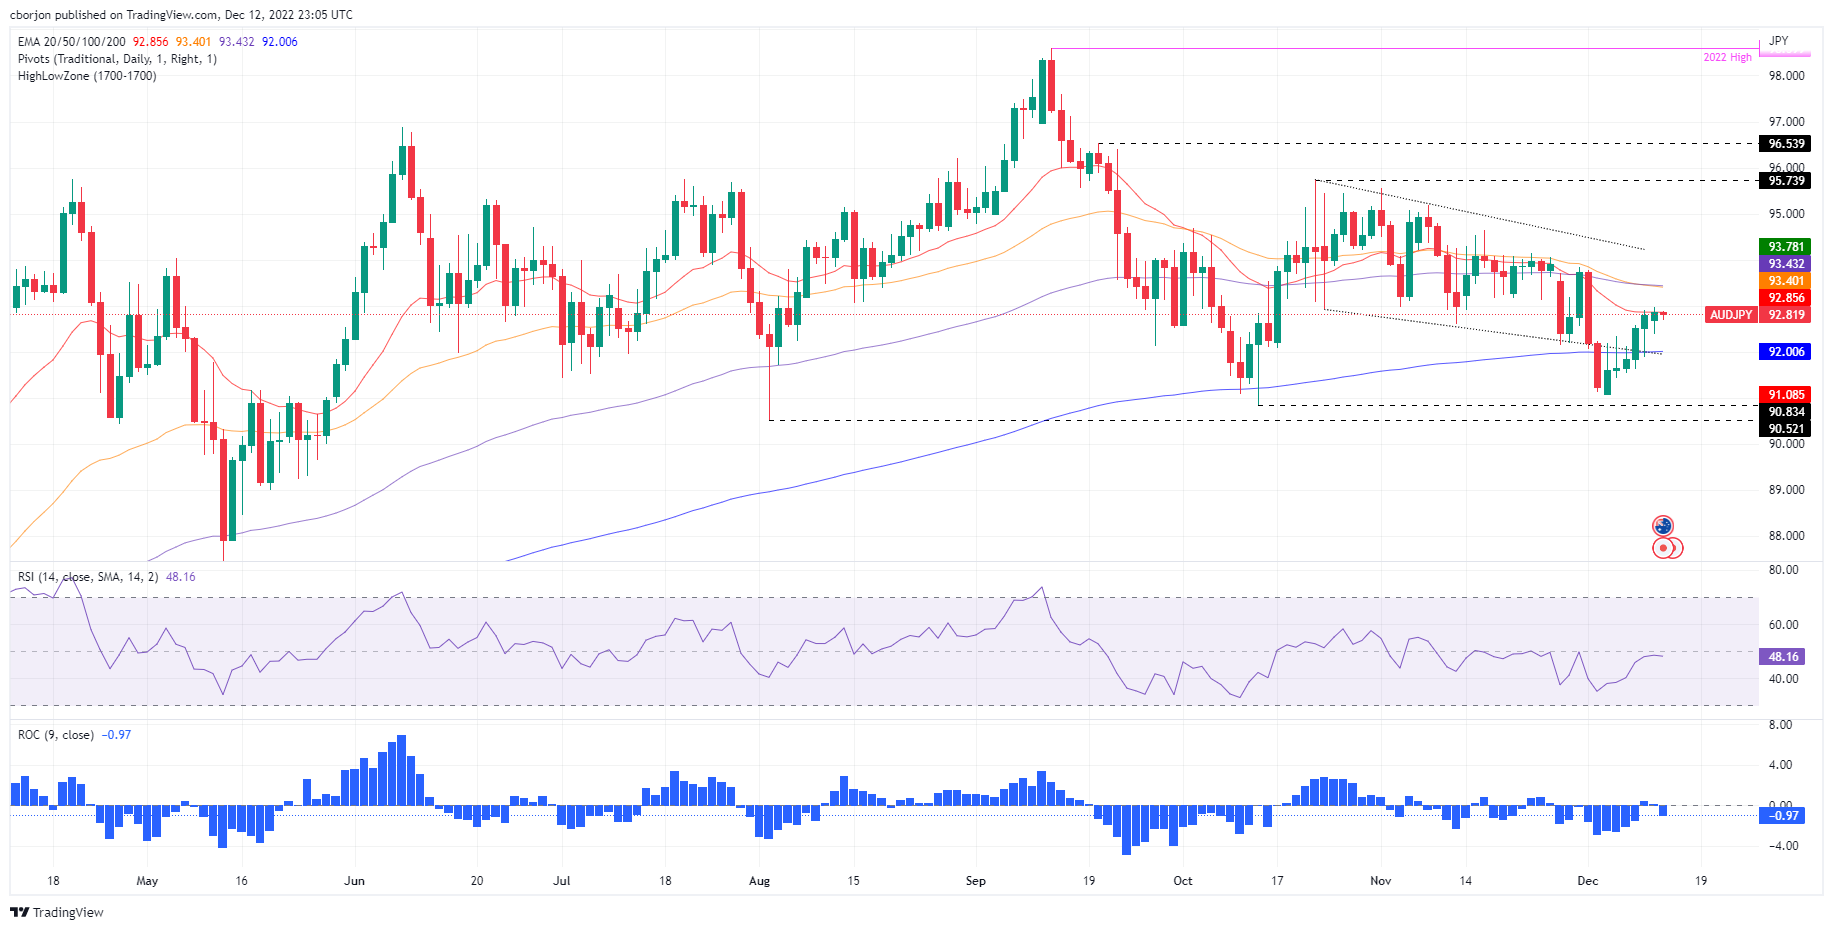
From a daily chart perspective, the cross-currency pair is neutral to upward biased, testing the 20-day Exponential Moving Average (EMA) at around 92.86. After bottoming on December 6 to its monthly lows of 91.08, it formed a double bottom, which would be confirmed, once the AUD/JPY clears the October 21 swing high of 95.74.
If that scenario plays out, the AUD/JPY following resistance would be the September 20 high of 96.54, followed by the YTD high at 98.60.
Traders should be aware that the Relative Strength Index (RSI) is in bearish territory and paused its uptrend while the Rate of Change (RoC) is about crossing above 0, meaning that buying pressure would be building in the near term.
As an alternate scenario, the AUD/JPY first support would be the 200-day Exponential Moving Average (EMA) at 92.00. Once cleared, the next support would be December’s 5 swing low of 91.08, followed by the August 2 pivot low at 90.83.
AUD/JPY Key Technical Levels