Gold Price Forecast: XAU/USD corrects to near $2,040.00 despite USD Index holds losses, US job data eyed
- Gold price has corrected to near $2,040.00 after printing a fresh all-time high at $2,079.76.
- The USD Index is holding losses amid various headwinds such as renewed US banking crisis and debt ceiling issues.
- US President Joe Biden is not interested in raising the debt ceiling at the cost of the President’s spending initiatives.
Gold price has retreated sharply to near $2,040.00 in the Asian session after printing all-time highs of $2,079.76. The precious metal has corrected swiftly as profit-booking kicked in after solid gains inspired by changed language on interest rate guidance from the Federal Reserve (Fed) after hiking critical rates by consecutive 25 basis points (bps) to 5.00-5.25%.
The USD Index is making efforts to defend its immediate support of 101.07, however, the downside seems favored due to various headwinds. US banking jitters have renewed as Bloomberg reported that PacWest Bancorp is considering strategic options, including a potential sale.
While fears of debt ceiling issues are accelerating as US President Joe Biden is not interested in raising the debt ceiling in negotiations with Republicans at the cost of the President’s spending initiatives.
Meanwhile, S&P500 futures have shown some recovery indicating a recovery in the risk-off market mood. Accelerating fears of the US debt ceiling have weighed heavily on Treasury yields. The yields offered on 10-year US government bonds have dropped to near 3.33%.
Going forward, US labor market data will be keenly watched. As per the expectations, the US Nonfarm Payrolls (NFP) data is seen at 179K lower than the former release of 236K. The Unemployment Rate is seen steady at 3.5%. Also, Average Hourly Earnings are seen as stable. Consistent labor cost index data could force the Fed to re-consider a pause in the rate-hiking spell as it could fuel inflationary pressures.
Gold technical analysis
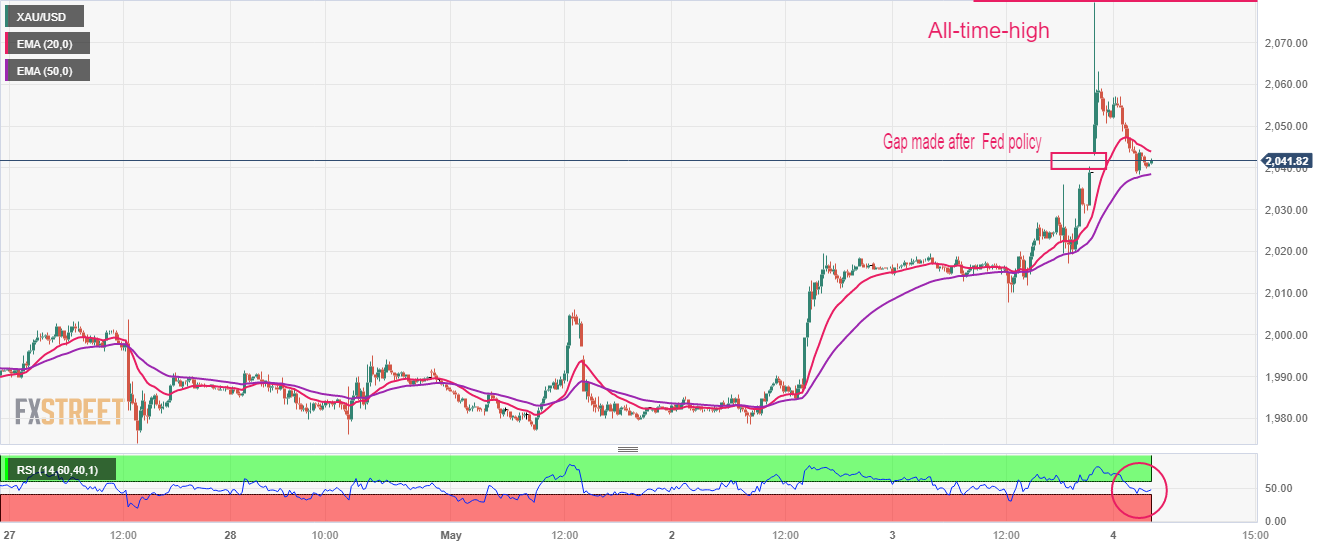
Gold price has corrected to near $2,040.00 after printing a fresh all-time high at $2,079.76. The precious metal has covered the gap made after the Fed policy on an intraday chart, which is acting as a cushion. Also, the 50-period Exponential Moving Average (EMA) at $2,038.56 is providing support to the Gold bulls. A recovery move above the 20-period EMA would support Gold bulls in reclaiming all-time highs.
The Relative Strength Index (RSI) (14) gauged support around 40.00 and is looking for a recovery.
Gold intraday chart