Gold Price Forecast: XAU/USD juggles around $2,050 as spotlight shifts to US NFP
- Gold price is oscillating in a narrow range around $2,050.00 ahead of the release of the US NFP.
- Households equipped with significant funds for disposal due to higher earnings would propel US inflation.
- Fallout in PacWest Bancorp shares after it considered strategic options for potential sale renewed fears of a US banking fiasco.
Gold price (XAU/USD) is displaying topsy-turvy moves around $2,050.00 in the early Asian session. The precious metal is struggling to find a direction as investors await the release of the United States official Employment data.
On Wednesday, the US Automatic Data Processing (ADP) agency showed the addition of fresh payrolls at 296K vs. the estimates of 150K and the former release of 145K. While the preliminary US Nonfarm Payrolls report shows an addition of 179K jobs in April, lower than former additions of 236K. The Unemployment Rate is seen stable at 3.5%.
The economic indicator that could trigger a power-pack action in the US Dollar is the Average Hourly Earnings data. The economic data is seen as steady but could have plenty of repercussions on US inflation. On Thursday, the preliminary Unit Labor Costs for the first quarter rose sharply to 6.3% from the estimates of 5.5% and the former release of 3.3%. Households equipped with significant funds for disposal would propel inflationary pressures and might make Federal Reserve’s (Fed) required data-dependent information supportive of a hawkish policy.
The US Dollar Index (DXY) has extended its recovery to near 101.45 despite fears of US banking crisis has soared. Fallout in PacWest Bancorp shares after it considered strategic options for potential sale renewed fears of a US banking fiasco inspired by higher interest rates from the Fed.
Gold technical analysis
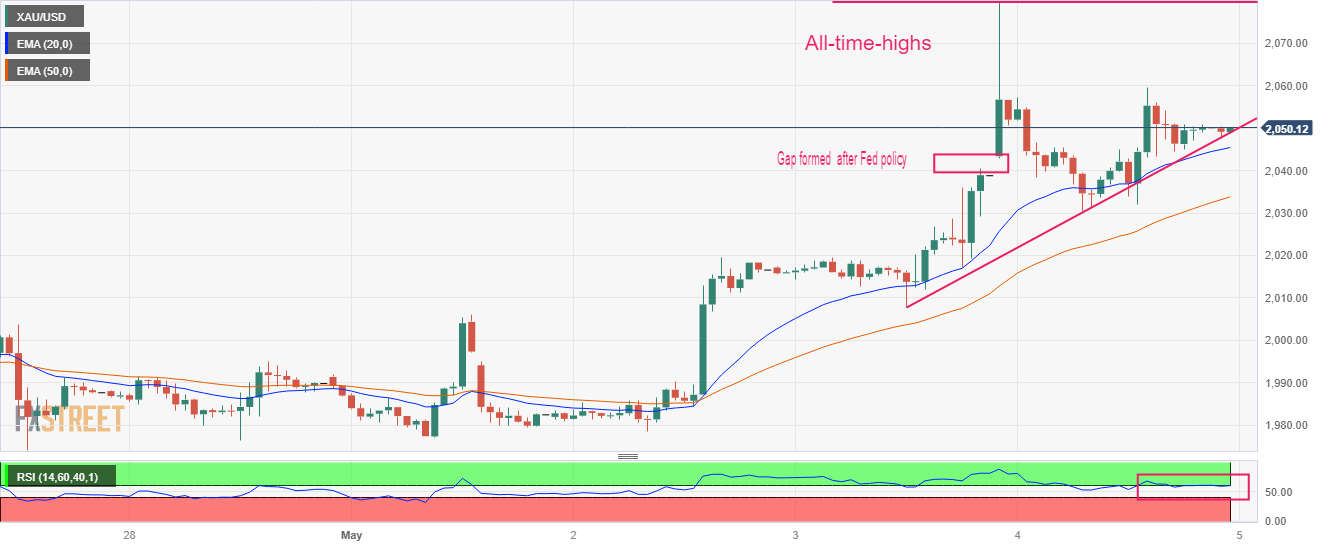
Gold price slipped sharply after printing a fresh all-time-high at $2,079.76 on an hourly scale. The precious metal is showing signs of volatility contraction after a strong one-sided auction. The upward-sloping trendline plotted from March 03 low at $2,007.39 is providing cushion to the Gold bulls.
Advancing 20-and 50-period Exponential Moving Averages (EMAs) at $2,045.81 and $2,034.02 respectively, indicate that the upside bias is extremely solid.
Meanwhile, the Relative Strength Index (RSI) (14) is still holding the bullish range of 60.00-80.00, which indicates that the upside momentum has not faded yet.
Gold hourly chart