Confirming you are not from the U.S. or the Philippines

یہ بیان دے کر، میں واضح طور پر یہ بتاتا اور تصدیق کرتا ہوں کہ:
  • میں امریکی شہری یا رہائشی نہیں ہوں
  • میں فلپائن کا رہائشی نہیں ہوں
  • میں بالواسطہ یا بلاواسطہ امریکی باشندوں کے 10 فیصد سے زیادہ شیئرز/ ووٹنگ کا حق/ امریکی باشندوں کے انٹرسٹ کا مالک نہیں ہوں اور/یا دوسرے ذرائع سے امریکی شہریوں یا رہائشیوں کو کنٹرول نہیں کرتا ہوں۔
  • میں بالواسطہ یا بلاواسطہ امریکی باشندوں کے 10 فیصد سے زیادہ شیئرز/ ووٹنگ کا حق/ انٹرسٹ کا مالک نہیں ہوں اور/ یا کسی دوسرے ذریعے سے امریکی شہری یا رہائشی کے کنٹرول میں نہیں ہوں۔
  • میں FATCA کے سیکشن (a)1504 کے معاملے میں امریکی شہریوں یا رہائشیوں کے ساتھ وابستہ نہیں ہوں
  • میں غلط اعلان کرنے پر اپنی ذمہ داری سے واقف ہوں۔
اس بیان کے مقاصد کے لئے، ریاستہائے متحدہ امریکہ کے تمام منحصر ممالک اور علاقوں کو امریکہ کے مرکزی علاقے کے برابر کردیا گیا ہے۔ میں اپنے اس بیان کی خلاف ورزی سے پیدا ہونے یا اس سے متعلق ہونے والے کسی بھی دعوے کے خلاف، بے ضرر آکٹا مارکیٹس انکارپوریٹڈ، اس کے ڈائریکٹرز اور افسران کا دفاع کرنے کا عہد کرتا ہوں۔
ہم آپ کی رازداری اور آپ کی ذاتی معلومات کے تحفظ کے لیے وقف ہیں۔ ہم محض اپنی پراڈکٹس اور سروسز کے متعلق خصوصی پیشکشوں اور اہم معلومات فراہم کرنے کے لیے ای میلز اکٹھا کرتے ہیں۔ اپنا ای میل ایڈریس دے کر، آپ ہم سے ایسے ای میلز وصول کرنے پر اتفاق کرتے ہیں۔ اگر آپ انسبسکرائب کرنا چاہتے ہیں یا کوئی سوالات یا خدشات ہوں تو، ہماری کسٹمر سپورٹ کو لکھیں۔
Octa trading broker
ٹریڈنگ اکاؤنٹ کھولیں
Back

EUR/USD Price Analysis: Bulls are pressured at a key juncture

  • EUR/USD bulls need to commit or face a significant slide toward 1.0520s. 
  • Bears eye a break of the 1.0670 support area. 

EUR/USD has traded down on the day and is lowing some 0.27% at the time of writing, traveling between a high of 1.0732 and a low of 1.0667 so far.

The daily chart shows that the price is pressured below the longer-term bullish trendline that is now considered to be a counter-trendline resistance.

EUR/USD daily chart

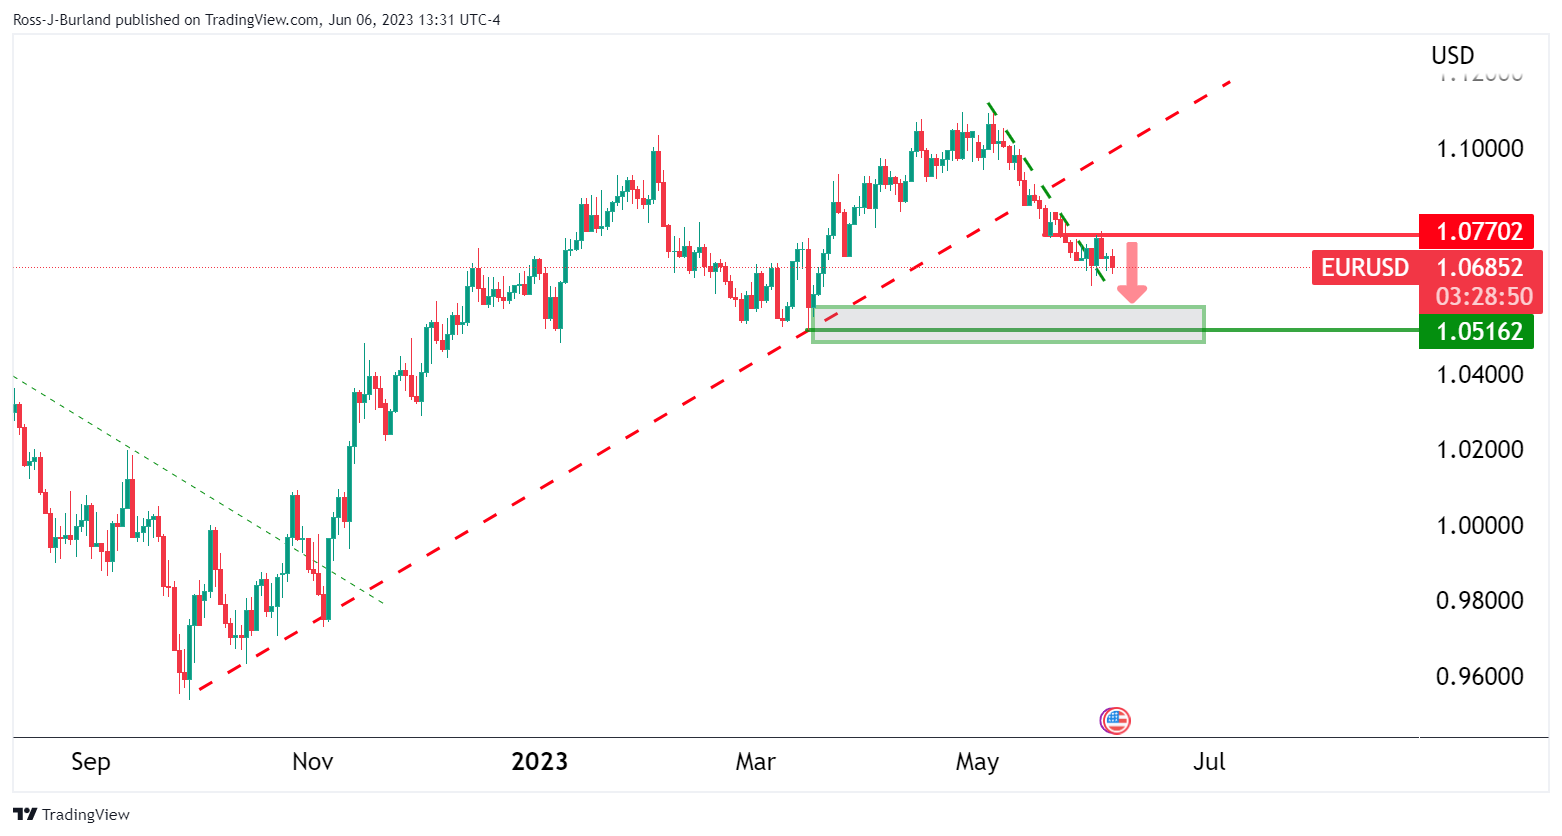
The price is also pressured below horizontal resistance, although it is sliding sideways out of the bearish trend.

EUR/USD H4 charts

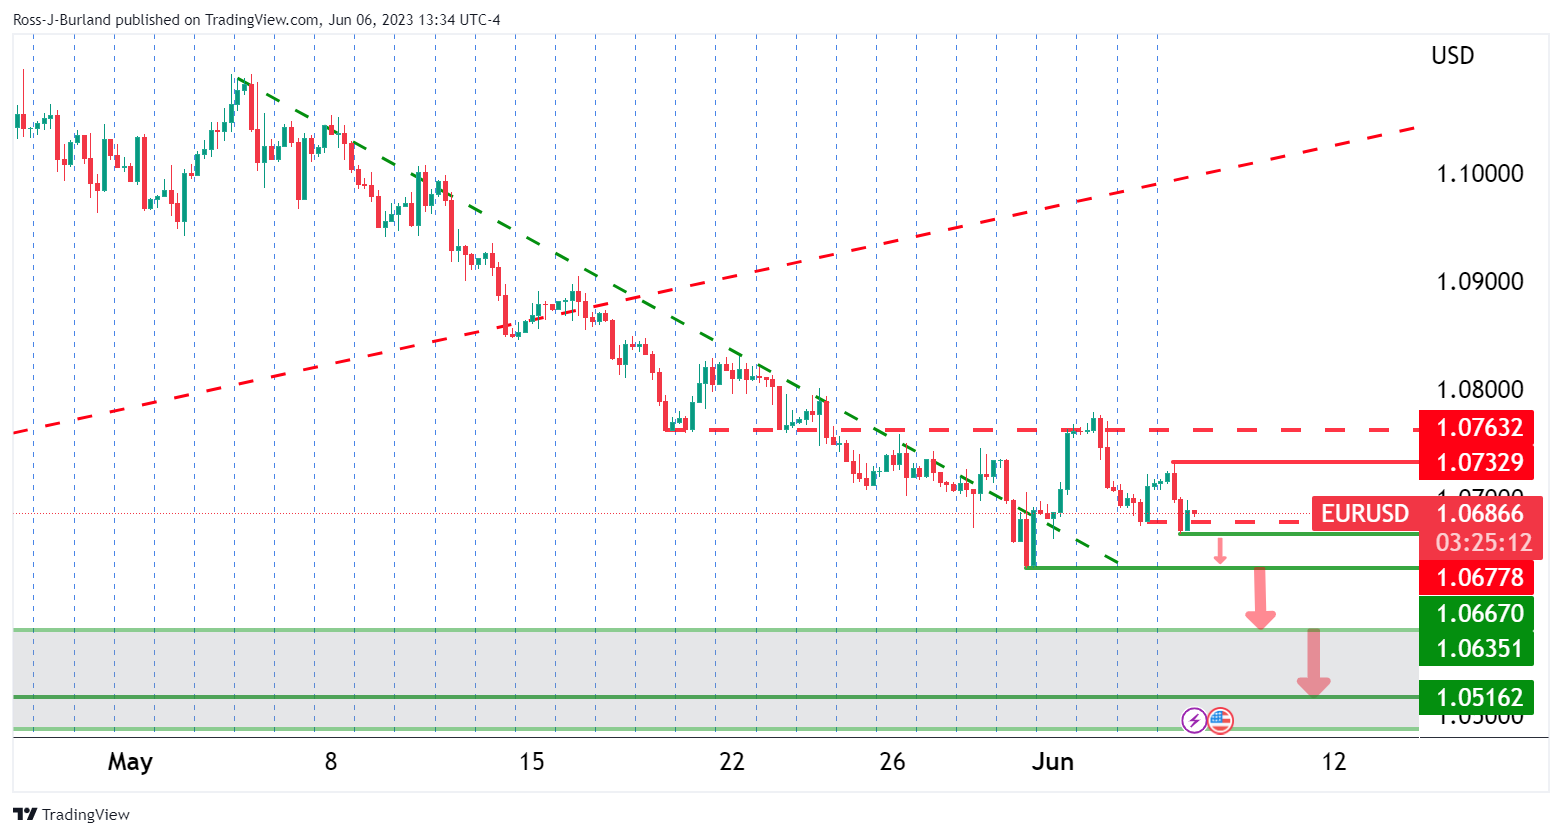
Moving down to the 4-hour charts for a closer inspection, we can see the price is trading sideways between 1.0670ish and 1.0730ish. While below resistance, 1.0770ish, the focus is on the downside and a test of the 1.0670ish support area. A break of here will open risk to test a daily 1.0520ish support area. 

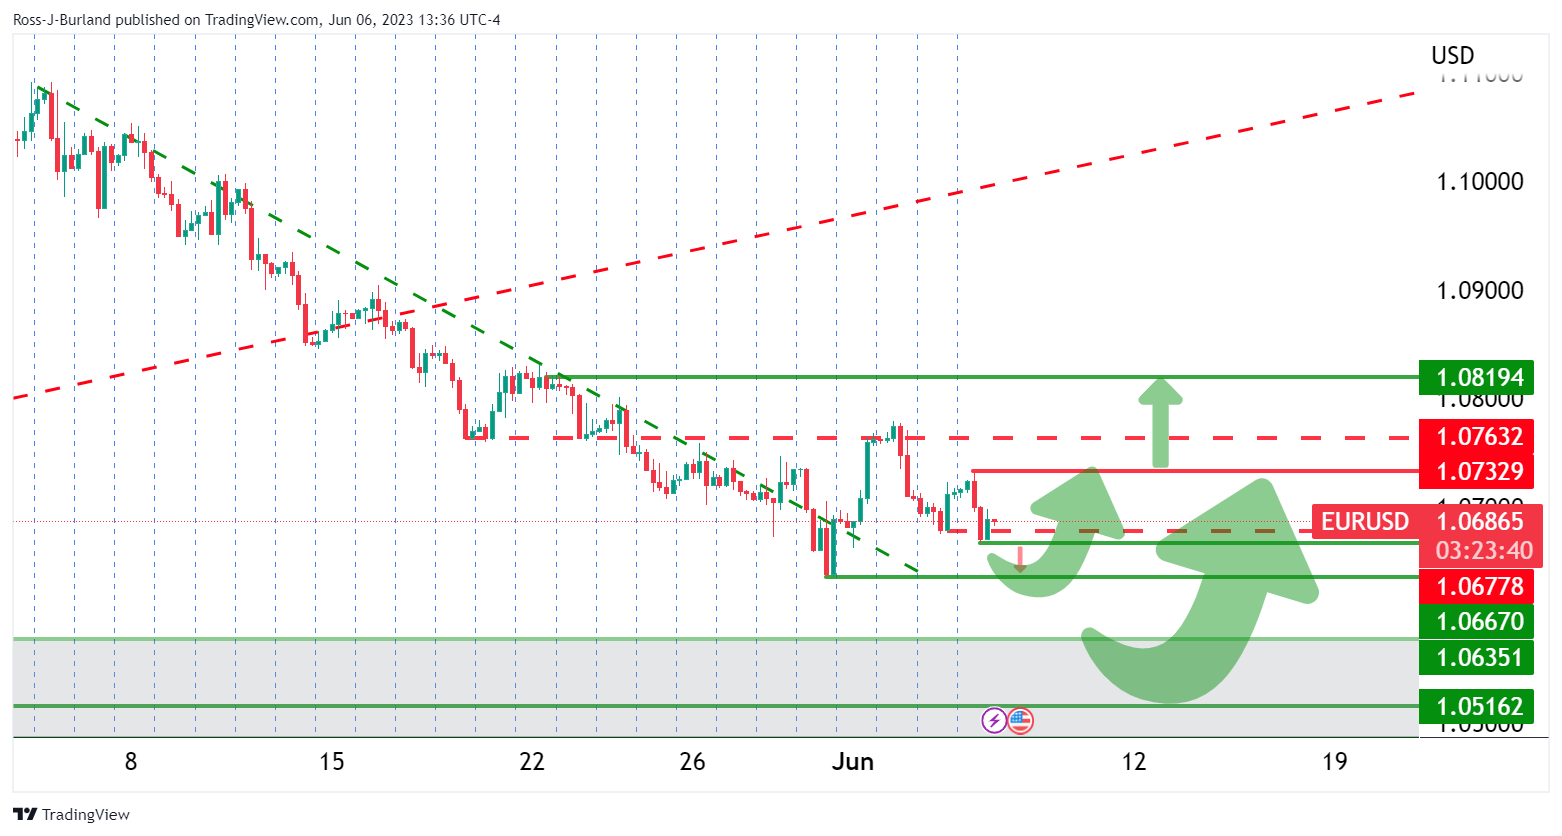
On the other hand, given we are on the backside of the old bearish trend, the market could just as easily stall at this juncture, or lower down, and turn higher as the above schematic illustrates. 

USD/CAD remains near three-week lows ahead of the BoC decision

The USD/CAD stretched lower on Tuesday trading in the 1.3389 - 1.3452 range despite the US dollar maintaining its foot versus other peers, with the DX
مزید پڑھیں Previous

WTI Price Analysis: Oil retakes the 20-day SMA amid OPEC cuts rumours

WTI rebounded at a daily low of $70.17 and managed to recover the 20-day SMA at $71.67 Rumors of further production cuts by the OPEC give traction to
مزید پڑھیں Next