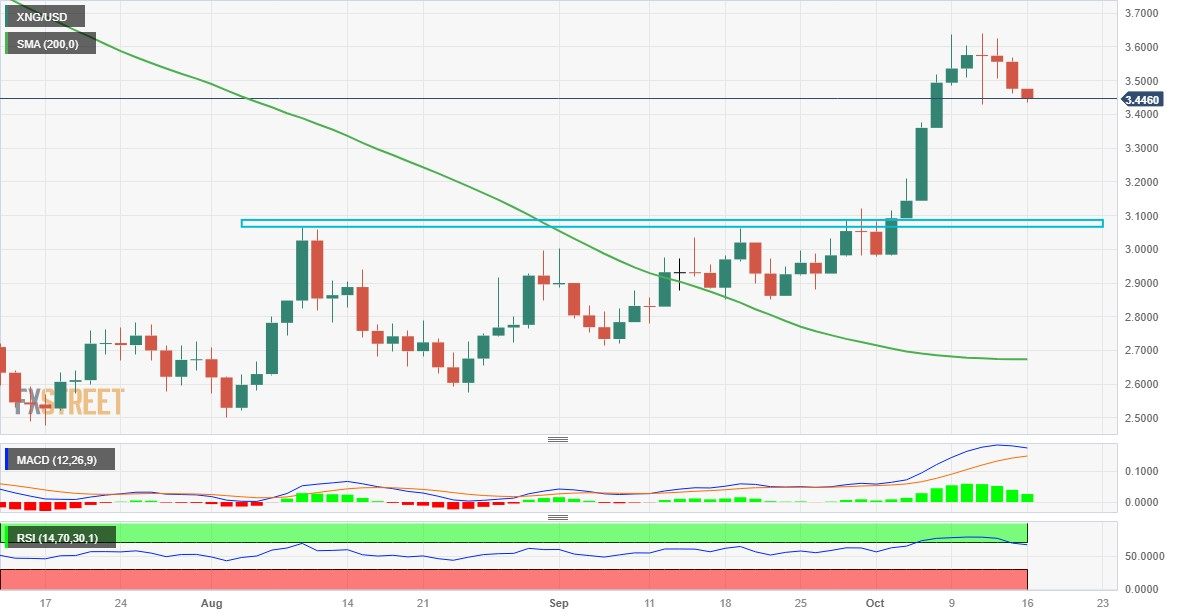
Natural Gas Price Analysis: XNG/USD flirts with last week's swing low, below $3.4500
- Natural Gas price drifts lower for the third straight day and moves away from a multi-month top.
- The technical setup favours bulls and supports prospects for the emergence of some dip-buying.
- A break below the $3.0650 resistance-turned-support is needed to negate the positive outlook.
Natural Gas price extends last week's retracement slide from a nine-month peak, around the $3.6350-$3.6400 area, and remains under some selling pressure for the third successive day on Monday. The XNG/USD trades around the $3.4400 level, down over 1% during the Asian session, though the technical setup warrants some caution before positioning for any further depreciating move.
Oscillators on the daily chart are holding comfortably in the positive territory and the Relative Strength (RSI) has also eased from an extremely overbought zone. This, along with the recent breakout through the $3.0650 strong horizontal barrier, suggests that the path of least resistance for the XNG/USD is to the upside and supports prospects for the emergence of some dip-buying at lower levels.
In the meantime, the $3.3600 level is likely to protect the immediate downside ahead of the $3.2100-$3.1960 support zone. This is followed by the $3.0650 resistance-turned-support, which now coincides with the 200-period Simple Moving Average (SMA) on the 4-hour chart. A convincing break below the latter could negate the positive outlook and prompt technical selling around the XNG/USD.
On the flip side, the $3.5000 area now seems to act as an immediate hurdle, above which the commodity could climb back to the multi-month top, around the $3.6350-$3.6400 region touched last week. Some follow-through buying will be seen as a fresh trigger for bulls and lift the XNG/USD to the $3.8770 en route to the $4.000 mark and the YTD high, around the $4.0380 touched in January.
XNG/USD daily chart

