Back
13 Nov 2018
GBP/USD Technical Analysis: Looking for lift, but bidders remain off-balance
- The GBP/USD pairing is trading just shy of the 1.2900 handle, a level that Sterling bulls are focused on as they try to shrug off Brexit angst and regain bullish control of the GBP/USD, but intraday action sees the pair remaining constrained within the low end despite multiple runs above 1.2900.
- GBP/USD has a clear range amid the Brexit endgame, jobs report — Confluence Detector
GBP/USD M5
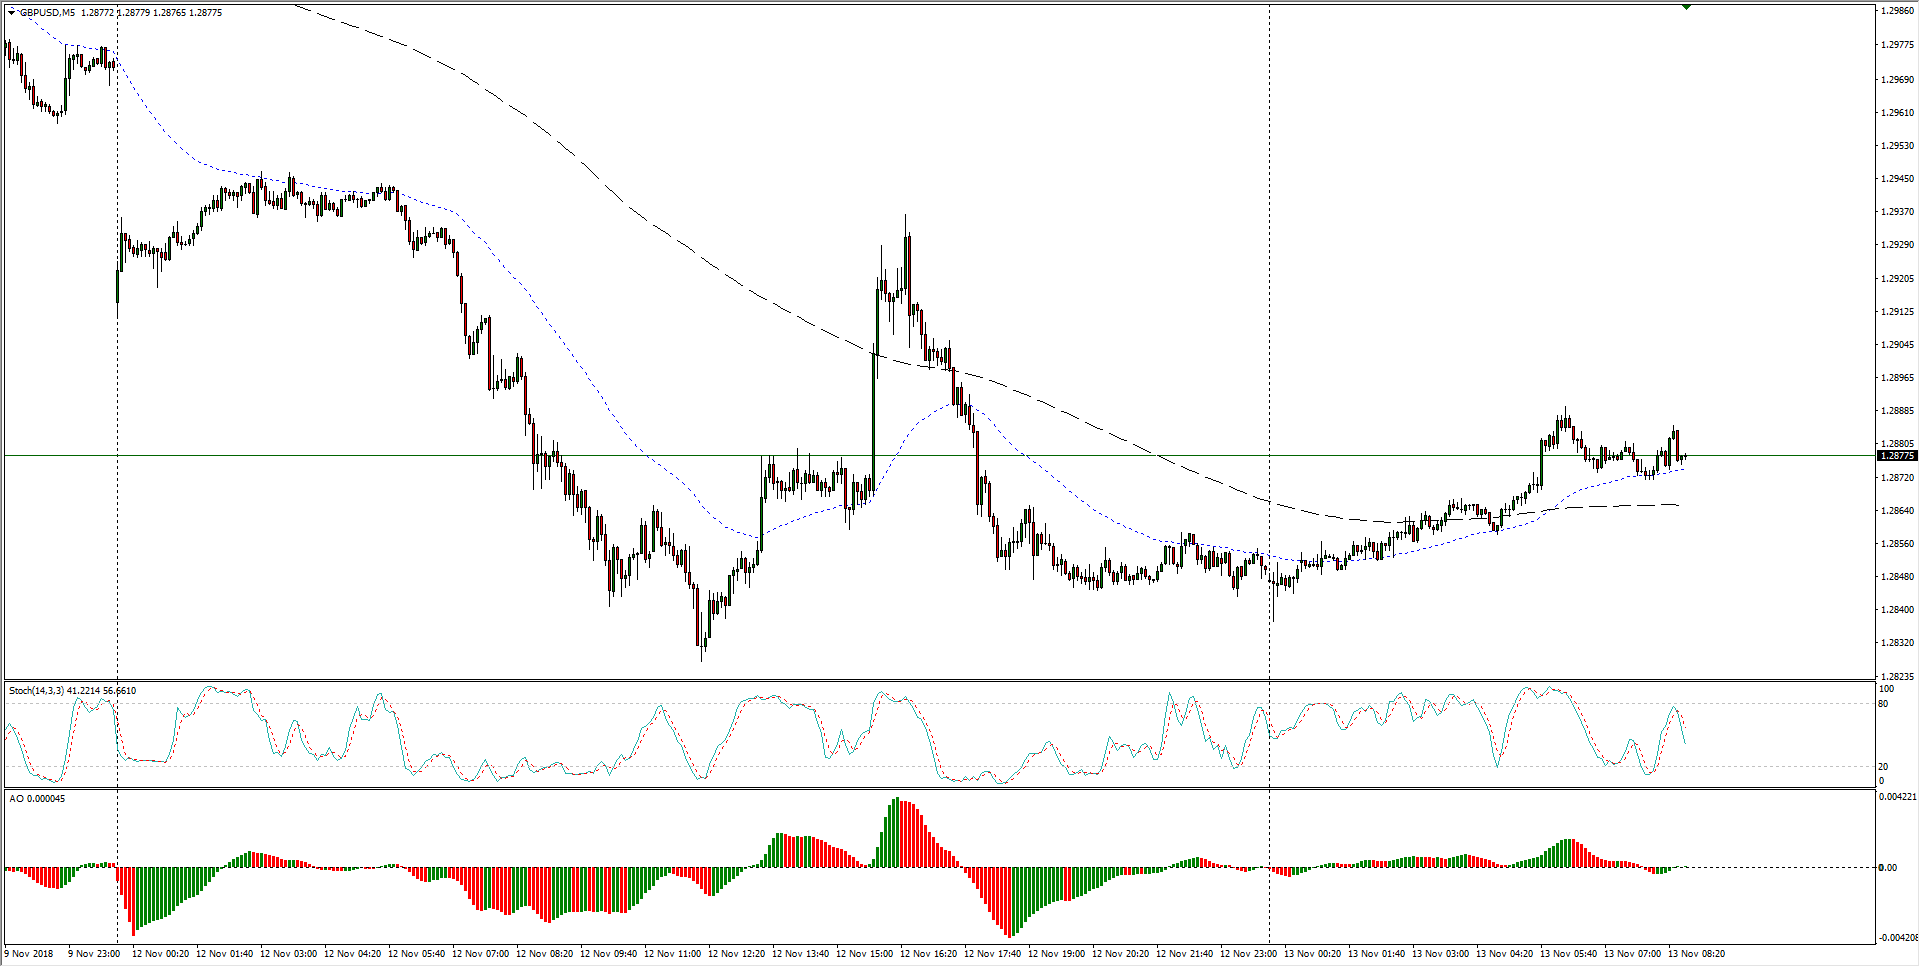
- Recent weeks have seen the GBP/USD slip into a bearish stance, with the current week's action forming a disconnected island chart pattern off of the week's opening bearish gap, and upside momentum is seeing challenges from the 50-period moving average.
GBP/USD M30
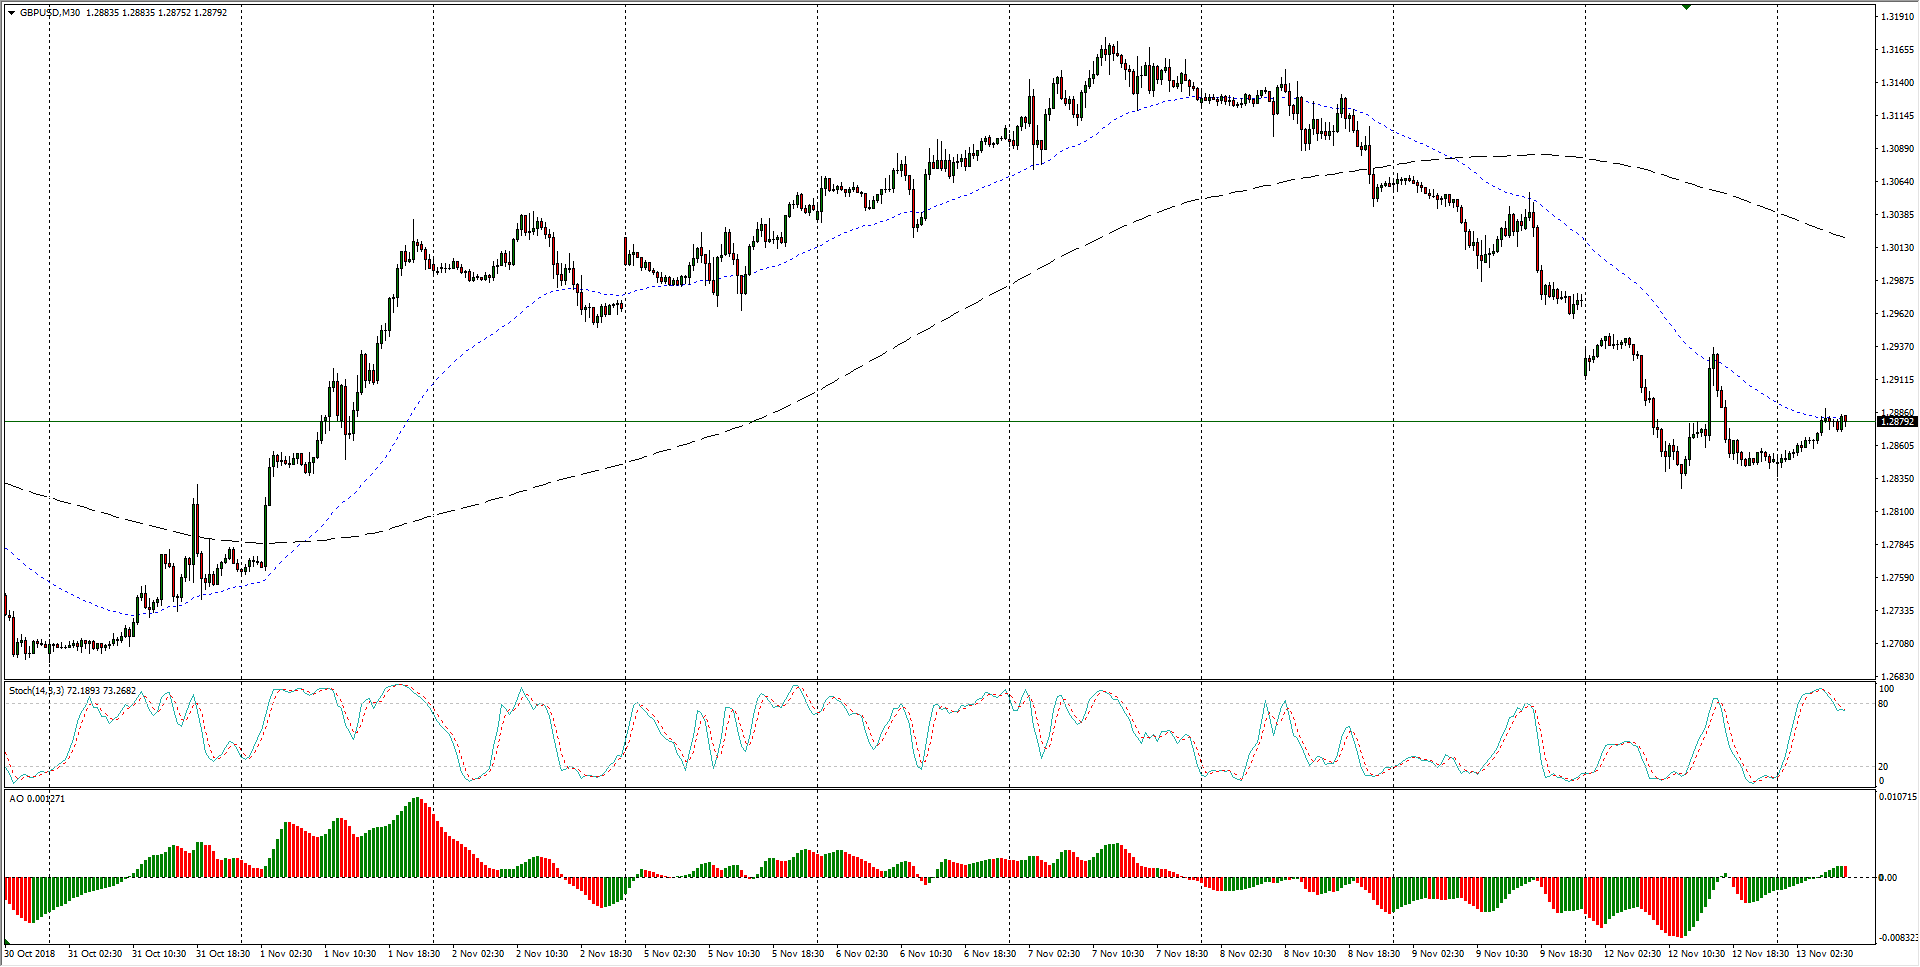
- The past two months have left the Cable spiraling in a rough sideways range, and with technical indicators picking up from oversold levels, any bullish momentum will see resistance from the 38.2% Fibo retracement level at 1.2960.
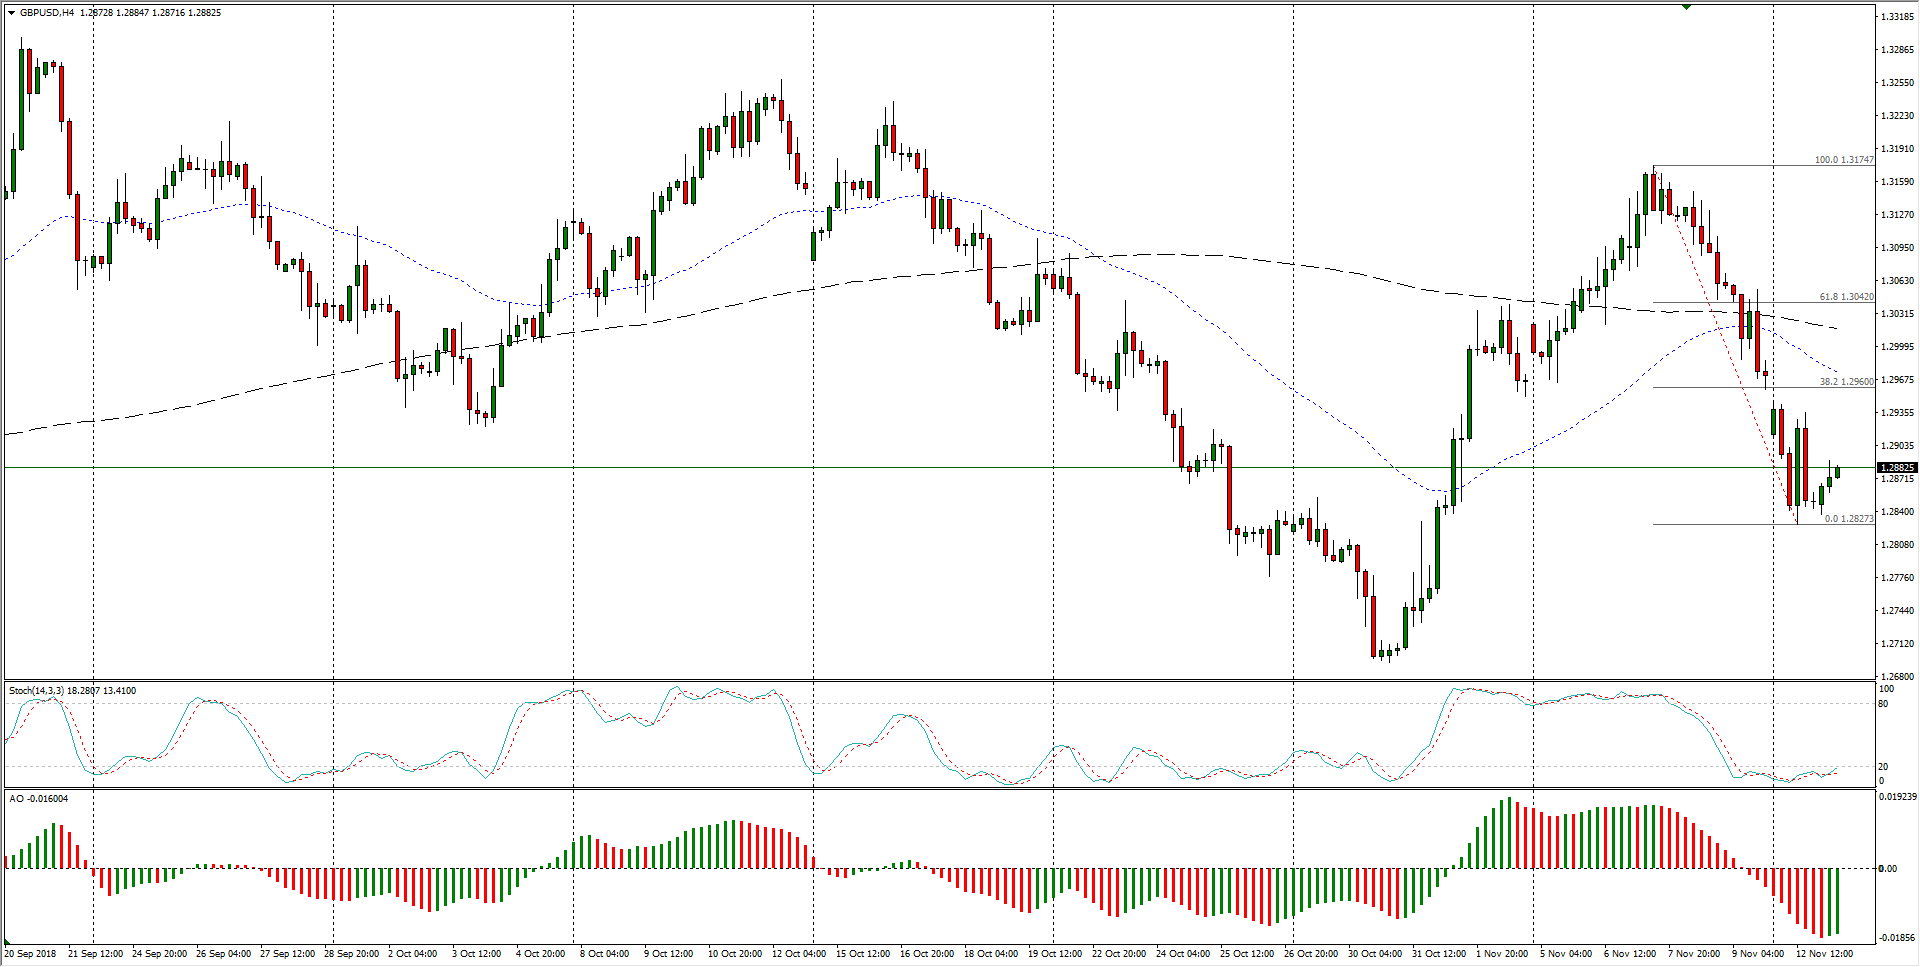
GBP/USD H4
GBP/USD
Overview:
Last Price: 1.288
Daily change: 27 pips
Daily change: 0.210%
Daily Open: 1.2853
Trends:
Daily SMA20: 1.2963
Daily SMA50: 1.3032
Daily SMA100: 1.303
Daily SMA200: 1.3396
Levels:
Daily High: 1.2948
Daily Low: 1.2827
Weekly High: 1.3176
Weekly Low: 1.2958
Monthly High: 1.326
Monthly Low: 1.2696
Daily Fibonacci 38.2%: 1.2874
Daily Fibonacci 61.8%: 1.2902
Daily Pivot Point S1: 1.2804
Daily Pivot Point S2: 1.2755
Daily Pivot Point S3: 1.2683
Daily Pivot Point R1: 1.2925
Daily Pivot Point R2: 1.2997
Daily Pivot Point R3: 1.3046