Back
16 Nov 2018
S&P500 Technical Analysis: Inverse Head-and-Shoulders pattern - Correction over - Game on for bulls - 2,820.00 target
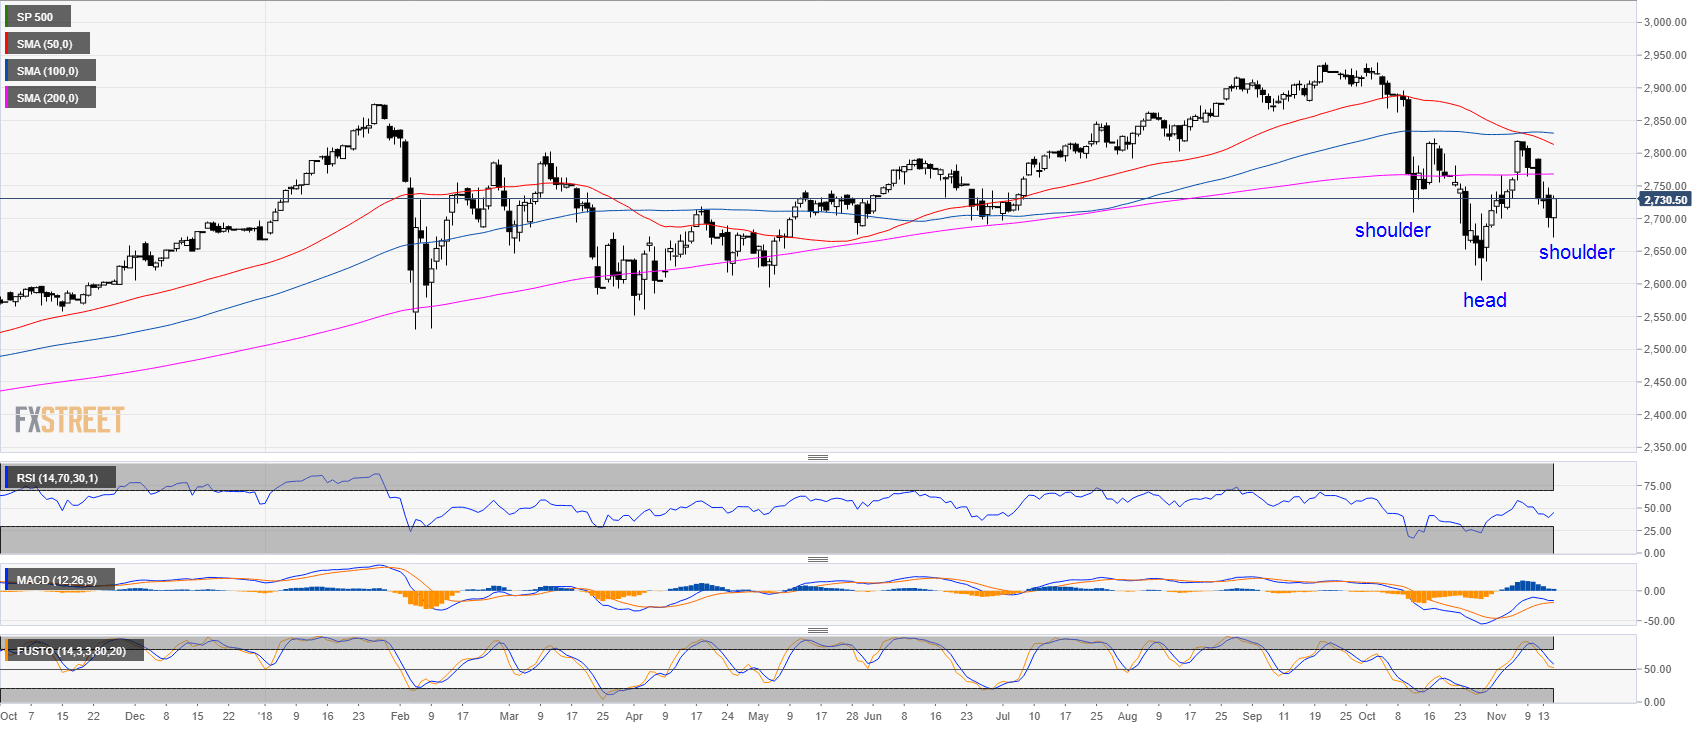
S&P500 daily chart
- The S&P500 an inverse head-and-shoulders pattern, which can potentially be bullish.
- The RSI is turning bullish, while the MACD and Stochastic are already in positive territories.
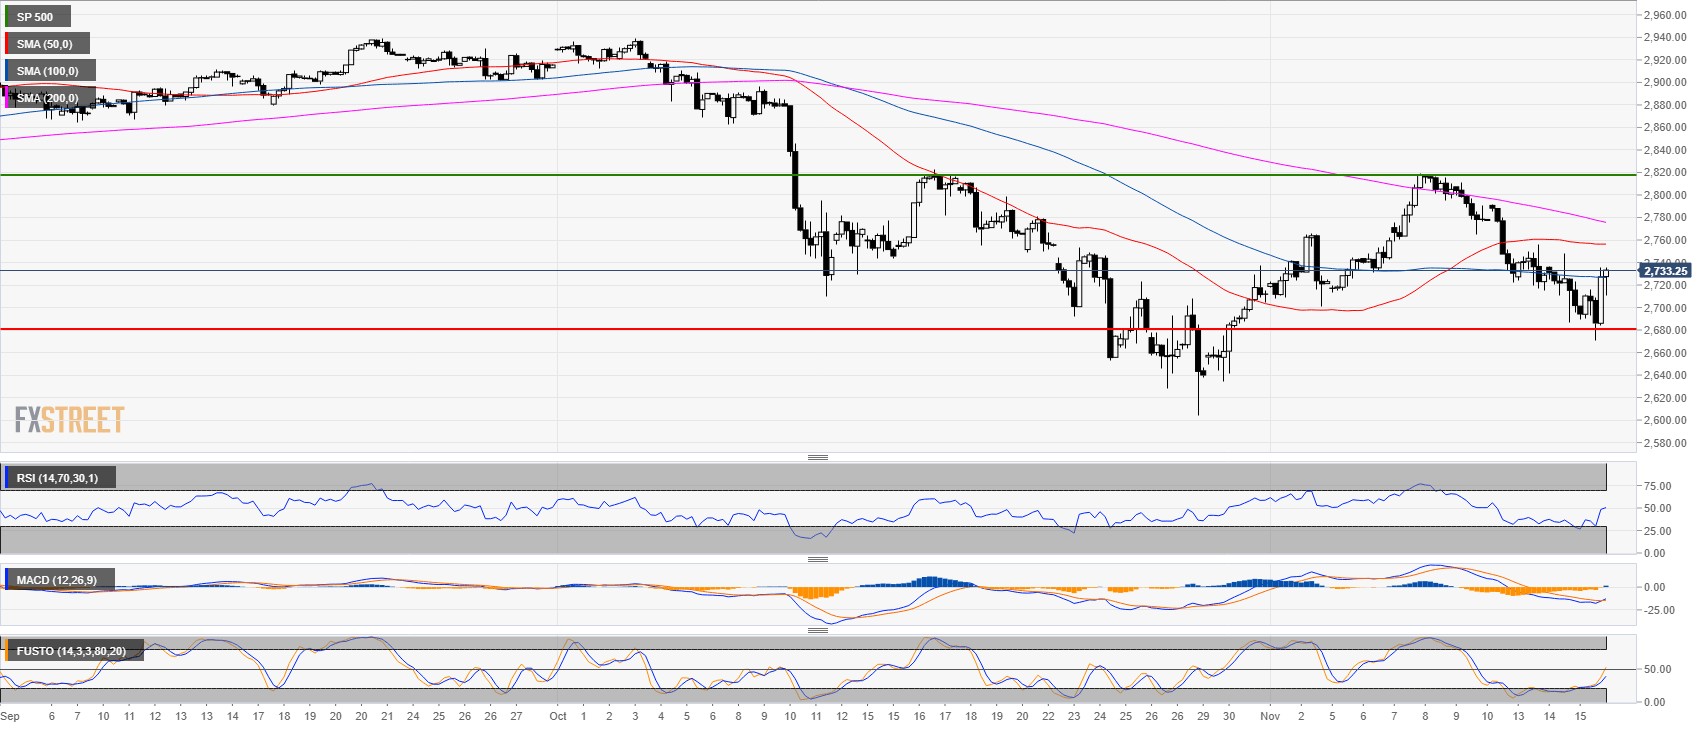
S&P500 4-hour chart
- The S&P500 found strong support at the 2,680.00 level as the bulls reclaimed the 50-period simple moving average (SMA).
- Technical indicators are picking up speed suggesting continued bullish momentum.
- The bull target is at 2,820.00 swing high. A bear breakout below 2,680.00 would be considered rather bearish.
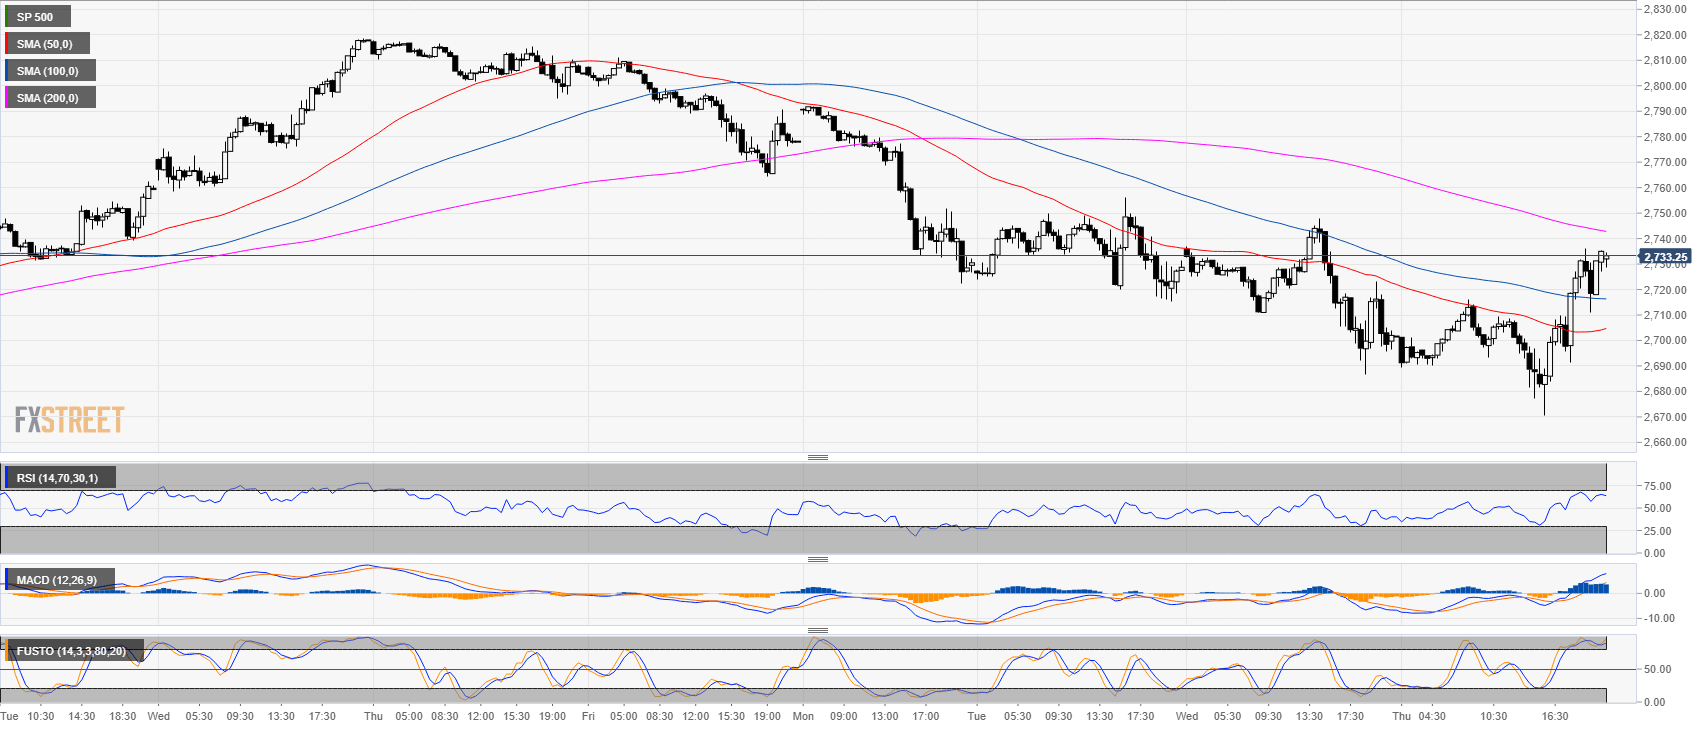
S&P500 30-minute chart
- The market is almost in full bullish mode on the 30-minute chart.
- The S&P500 broke above the 50 and 100 SMA while technical indicators are in positive territories.
Additional key levels at a glance:
SP 500
Overview:
Last Price: 2733.25
Daily change: 3.2e+3 pips
Daily change: 1.17%
Daily Open: 2701.75
Trends:
Daily SMA20: 2730.8
Daily SMA50: 2816.8
Daily SMA100: 2831.22
Daily SMA200: 2768.04
Levels:
Daily High: 2748
Daily Low: 2686.5
Weekly High: 2818.75
Weekly Low: 2713.5
Monthly High: 2939.5
Monthly Low: 2604.5
Daily Fibonacci 38.2%: 2709.99
Daily Fibonacci 61.8%: 2724.51
Daily Pivot Point S1: 2676.17
Daily Pivot Point S2: 2650.58
Daily Pivot Point S3: 2614.67
Daily Pivot Point R1: 2737.67
Daily Pivot Point R2: 2773.58
Daily Pivot Point R3: 2799.17