Dollar Index Technical Analysis: DXY's struggle for direction continues
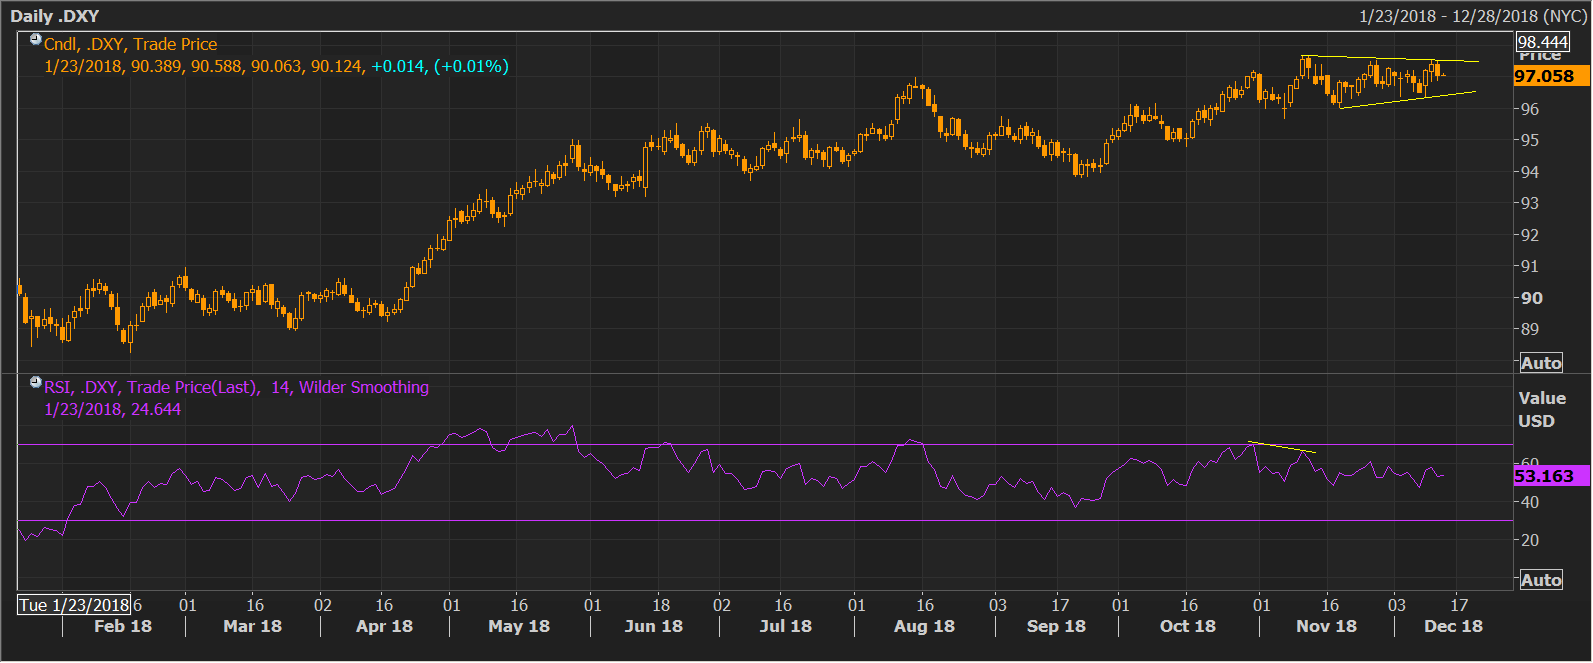
- The dollar index (DXY), which tracks the value of the greenback against majors, hit a high of 97.69 on Nov. 12 and has struggled for direction ever since.
- As of writing, it is seen at 97.06 and is trapped in a narrowing price range or a symmetrical triangle pattern.
- A break below 93.64 would imply range breakdown and validate the bearish divergence of the 14-day RSI (confirmed on Nov. 12) and hence could yield a drop to support at 95.00.
- A daily close above 97.53 would confirm a symmetrical triangle breakout and open the doors to 98.50 (May 8, 2017 low).
- A symmetrical triangle looks more likely, courtesy of dovish Fed expectations and falling haven demand amid the rising odds of US-China trade deal.
Daily chart
Trend: Neutral
Dollar Index Spot
Overview:
Today Last Price: 97.06
Today Daily change: 1.0 pips
Today Daily change %: 0.0103%
Today Daily Open: 97.05
Trends:
Previous Daily SMA20: 96.9
Previous Daily SMA50: 96.47
Previous Daily SMA100: 95.8
Previous Daily SMA200: 94.18
Levels:
Previous Daily High: 97.49
Previous Daily Low: 96.89
Previous Weekly High: 97.21
Previous Weekly Low: 96.37
Previous Monthly High: 97.7
Previous Monthly Low: 95.68
Previous Daily Fibonacci 38.2%: 97.12
Previous Daily Fibonacci 61.8%: 97.26
Previous Daily Pivot Point S1: 96.8
Previous Daily Pivot Point S2: 96.54
Previous Daily Pivot Point S3: 96.2
Previous Daily Pivot Point R1: 97.4
Previous Daily Pivot Point R2: 97.74
Previous Daily Pivot Point R3: 98