Back
11 Feb 2019
USD/JPY Technical Analysis: 110.00 again comes into play
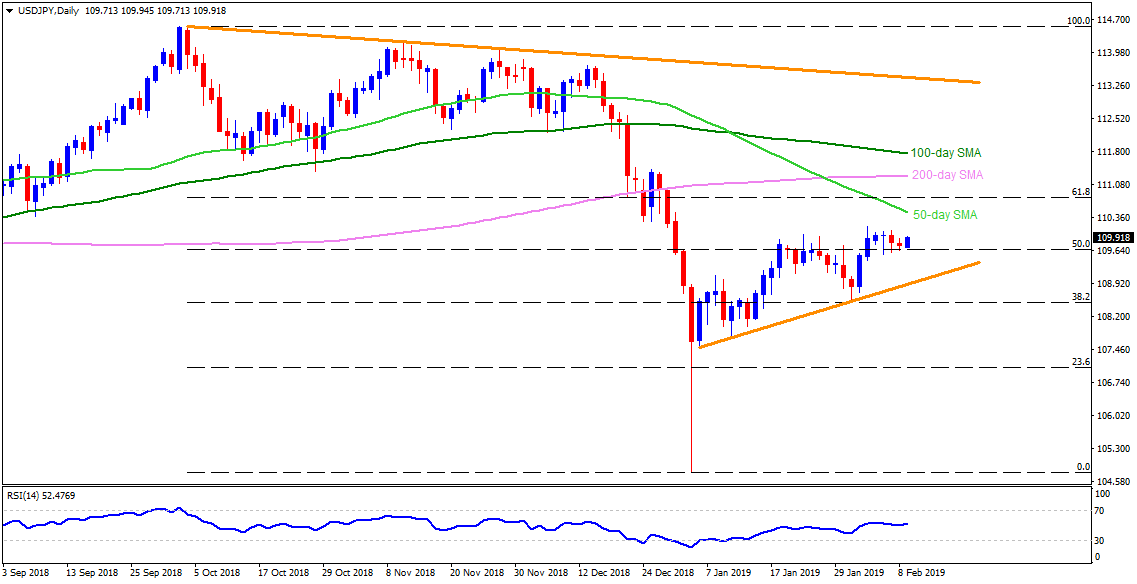
USD/JPY daily chart
- The USD/JPY pair trades positively towards confronting 110.00 at the initial hours of Asian sessions on Monday.
- The round-figure has recently confined the pair’s upside multiple times and a break of which could trigger an upside targeting 110.30 and 50-day simple moving average (SMA) level of 110.50.
- During the pair’s successful rise past-110.50, the 200-day SMA level of 111.25 and 111.80 including 100-day SMA can please the buyers.
- On the downside, 50% Fibnacci Retracement of its October-January decline, at 109.60, becomes immediate support for the pair, breaking which 109.10 may gain market attention.
- Additionally pair’s drop under 109.10 can highlight the importance of an upward sloping trend-line, at 108.85.

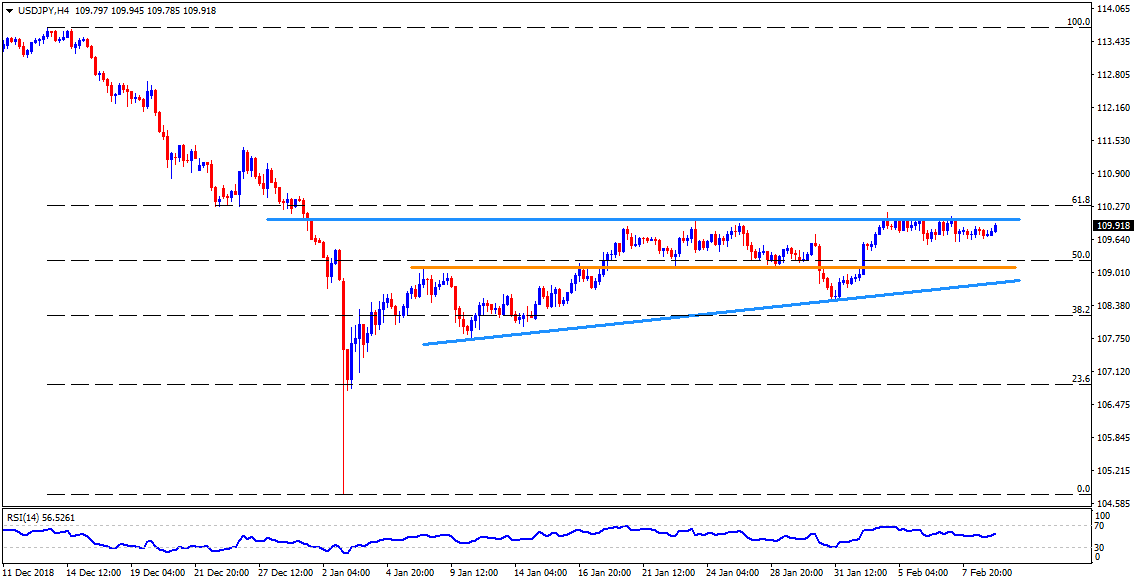
USD/JPY 4-Hour chart
- The H4 chart magnifies the importance of 110.00 horizontal resistance with 61.8% Fibonacci Retracement of its December – January slump, at 110.30, being following upside level to watch before targeting 110.50.
- Meanwhile, 109.60 and the 109.10 can keep limiting nearby downside of the pair, a break of which can challenge sellers with an upward sloping support-line of 108.85.

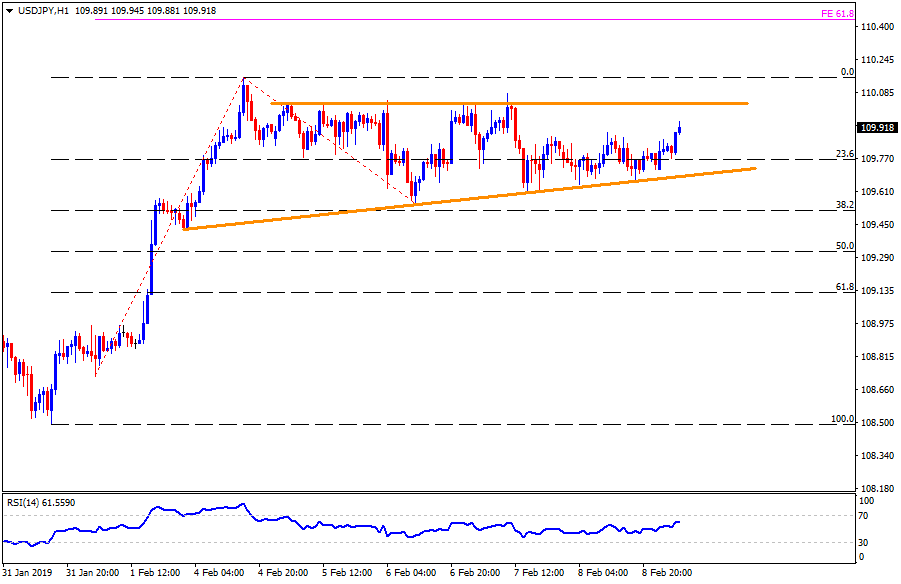
USD/JPY hourly chart
- On the hourly chart, 110.15 may act as intermediate halt during the pair’s rise after 110.00 and before 61.8% Fibonacci expansion of its recent upside, at 110.45.
- Alternatively, 109.40 may offer as a buffer stop past-109.60 support-line break.

