Back
19 Feb 2019
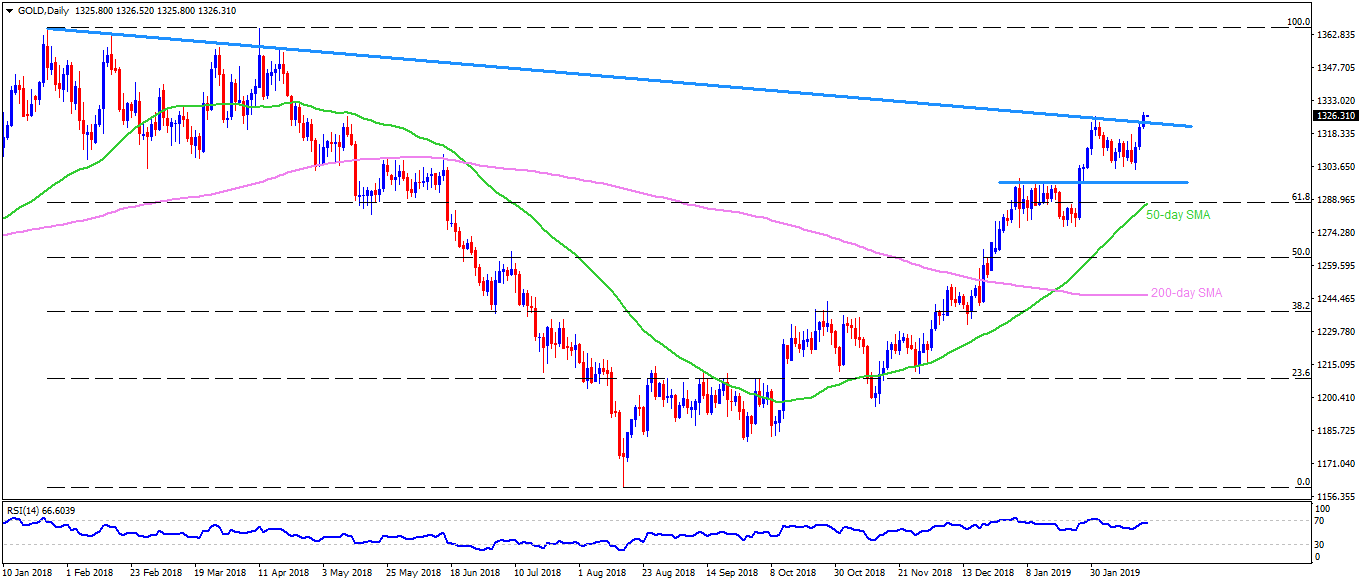
Gold Technical Analysis: $1328 questions 2019 high, $1322 offers immediate support
- Gold trades around $1326.20 at the start of Asian trading on Tuesday.
- The yellow metal surged to the fresh yearly high, also the highest level since April 2018, of $1327.60 on Monday.
- At the start, the bullion seems finding it hard to extend recent upside and hence need to assure buyers with a break of $1328 in order to extend latest increase towards mid-April 2018 lows near $1334.
- Given the quote manage to stretch its rise beyond $1334 on a daily closing basis, $1341, $1349 and $1356 may act as intermediate halts during its rally to 2018 high around $1366.
- Meanwhile, a downside break of resistance-turned-support connecting highs marked since 2018, at $1322, can offer immediate rest.
- If prices dip under $1322, recent upside signal past breakout can be negated with brighter chances of $1316 comeback.
- In case sellers refrain to stop under $1316, $1302 and a horizontal-line joining early January highs, at $1296, become crucial to watch.
Gold daily chart
XAU/USD
Overview:
Today Last Price: 1326.46
Today Daily change: 5.36 pips
Today Daily change %: 0.41%
Today Daily Open: 1321.1
Trends:
Daily SMA20: 1305.66
Daily SMA50: 1285.19
Daily SMA100: 1254.6
Daily SMA200: 1232.57
Levels:
Previous Daily High: 1322.55
Previous Daily Low: 1305.9
Previous Weekly High: 1322.55
Previous Weekly Low: 1303.15
Previous Monthly High: 1326.25
Previous Monthly Low: 1275.9
Daily Fibonacci 38.2%: 1316.19
Daily Fibonacci 61.8%: 1312.26
Daily Pivot Point S1: 1310.48
Daily Pivot Point S2: 1299.87
Daily Pivot Point S3: 1293.83
Daily Pivot Point R1: 1327.13
Daily Pivot Point R2: 1333.17
Daily Pivot Point R3: 1343.78