Back
19 Feb 2019
AUD/JPY Technical Analysis: Descending triangle limits the upside around 79.20 ahead of RBA minutes
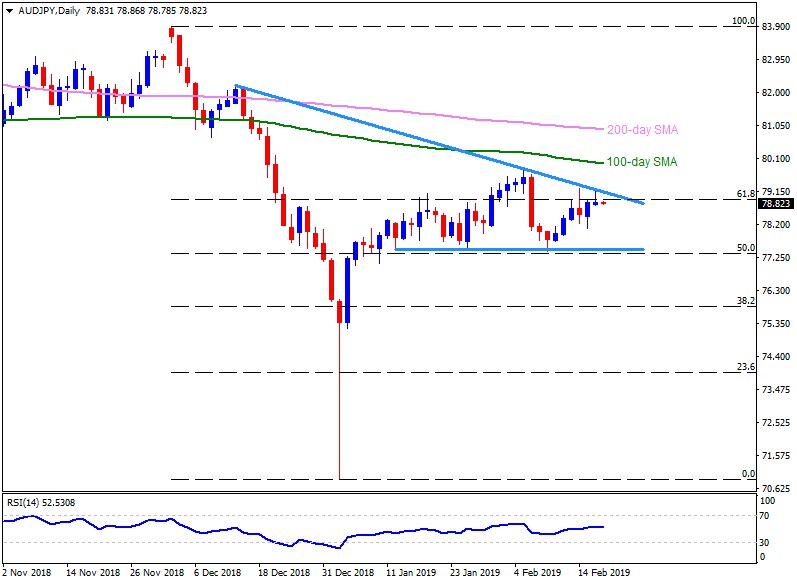
AUD/JPY daily chart
- AUD/JPY trades little changed around 78.85 before the RBA minutes’ release on early Tuesday.
- The pair follows a short-term descending triangle formation on the daily chart with 79.20 being immediate resistance to observe.
- Should the pair cross 79.20 hurdle, it can rise to an early month high around 79.85 whereas 100-day simple moving average (SMA) of 79.95 and the 80.00 may entertain buyers afterward.
- During the pair’s successful advance above 80.00, the 200-day SMA level of 80.95 can appear on bull’s radar.
- Alternatively, 78.00 seem nearby support for the pair ahead of highlighting the 77.55-50 support-zone.
- In case the quote slips under 77.50, 77.00 and 76.00 may gain sellers’ attention.

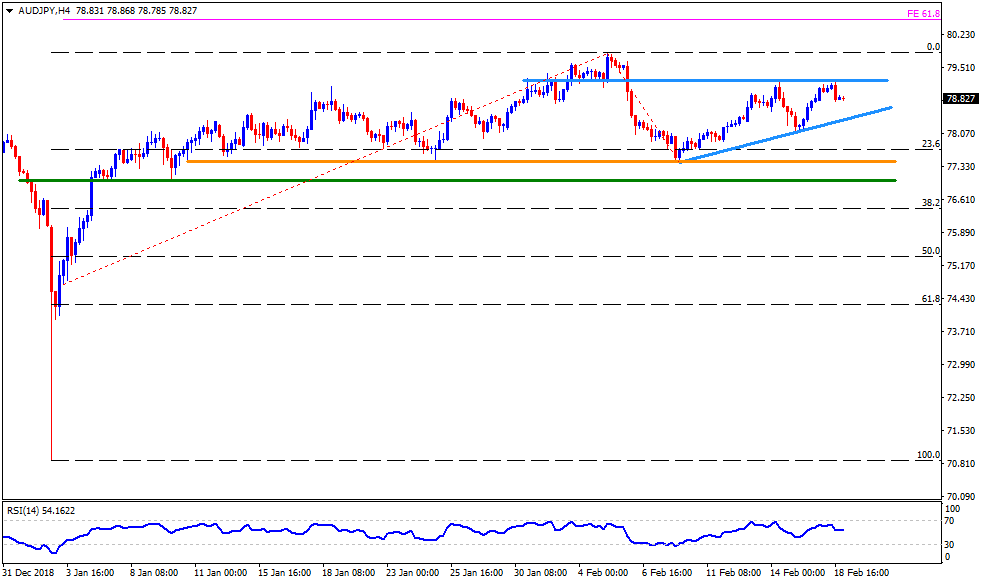
AUD/JPY 4-Hour chart
- An upward sloping trend-line connecting recent lows offer nearby support to the pair around 78.30 on H4, a break of which can drag it to 78.00.
- On the upside, 79.20 holds the gate for its rise to 79.85 whereas 61.8% Fibonacci expansion (FE) may please the optimists then after.

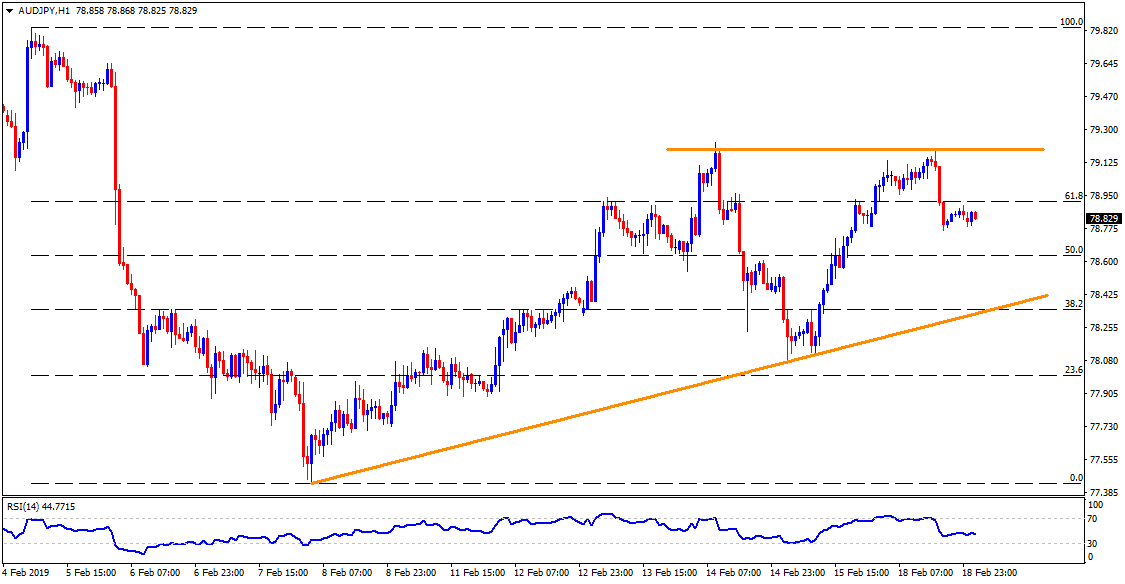
AUD/JPY hourly chart
- 50% Fibonacci retracement of Feb 05-08 downturn, at 78.60, becomes adjacent support on H1 prior to fetching the quote to 78.30 support-line.
- An upside clearance of 79.20 may avail 79.50 as a halt before aiming for 79.70 and 79.85 numbers to the north.

