AUD/USD Technical Analysis: Aussie jumps to 2-week highs near 0.7170 level
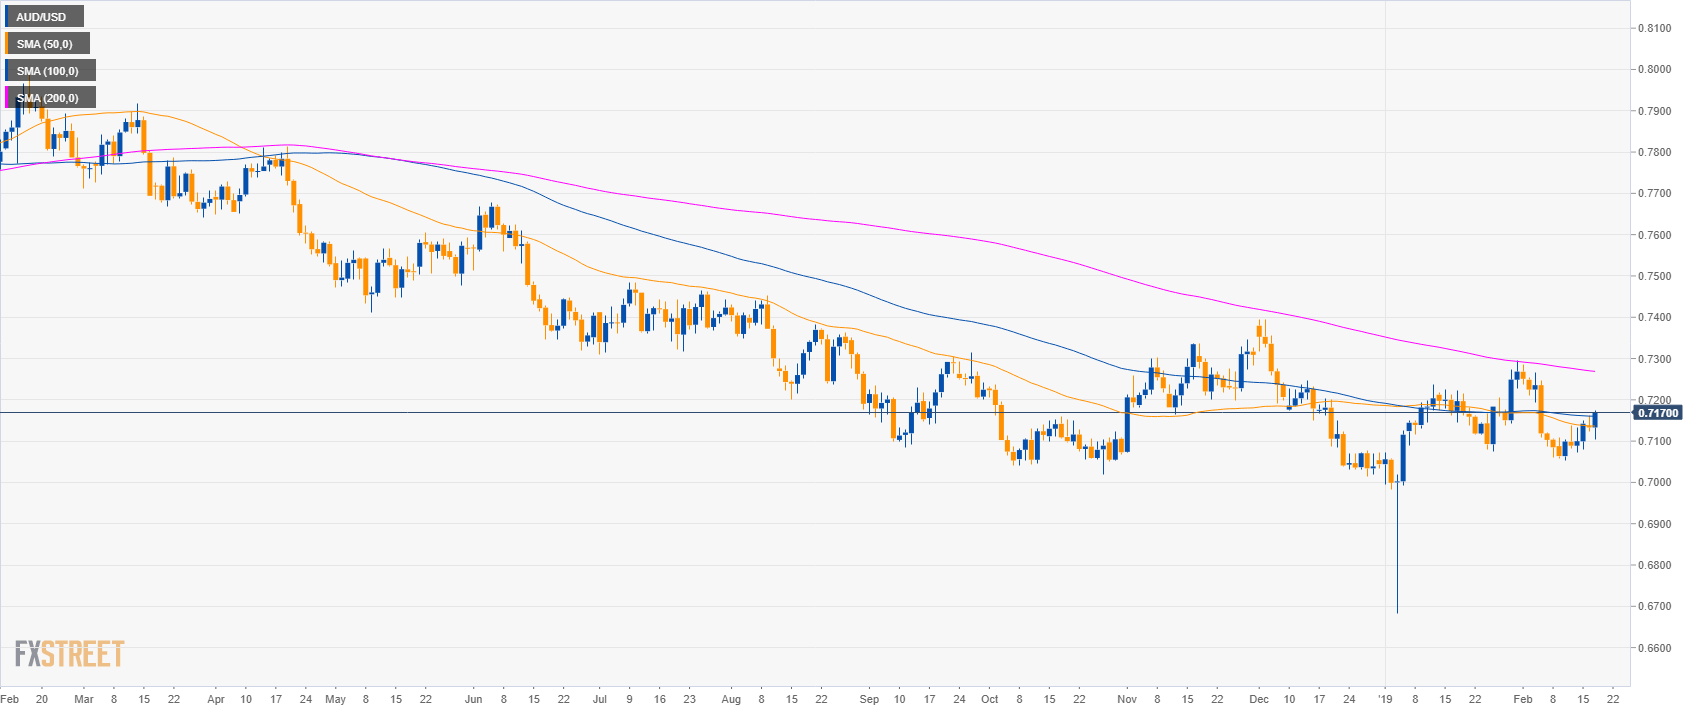
AUD/USD daily chart
- AUD/USD is trading in a bear trend below the 200-day simple moving average (SMA).
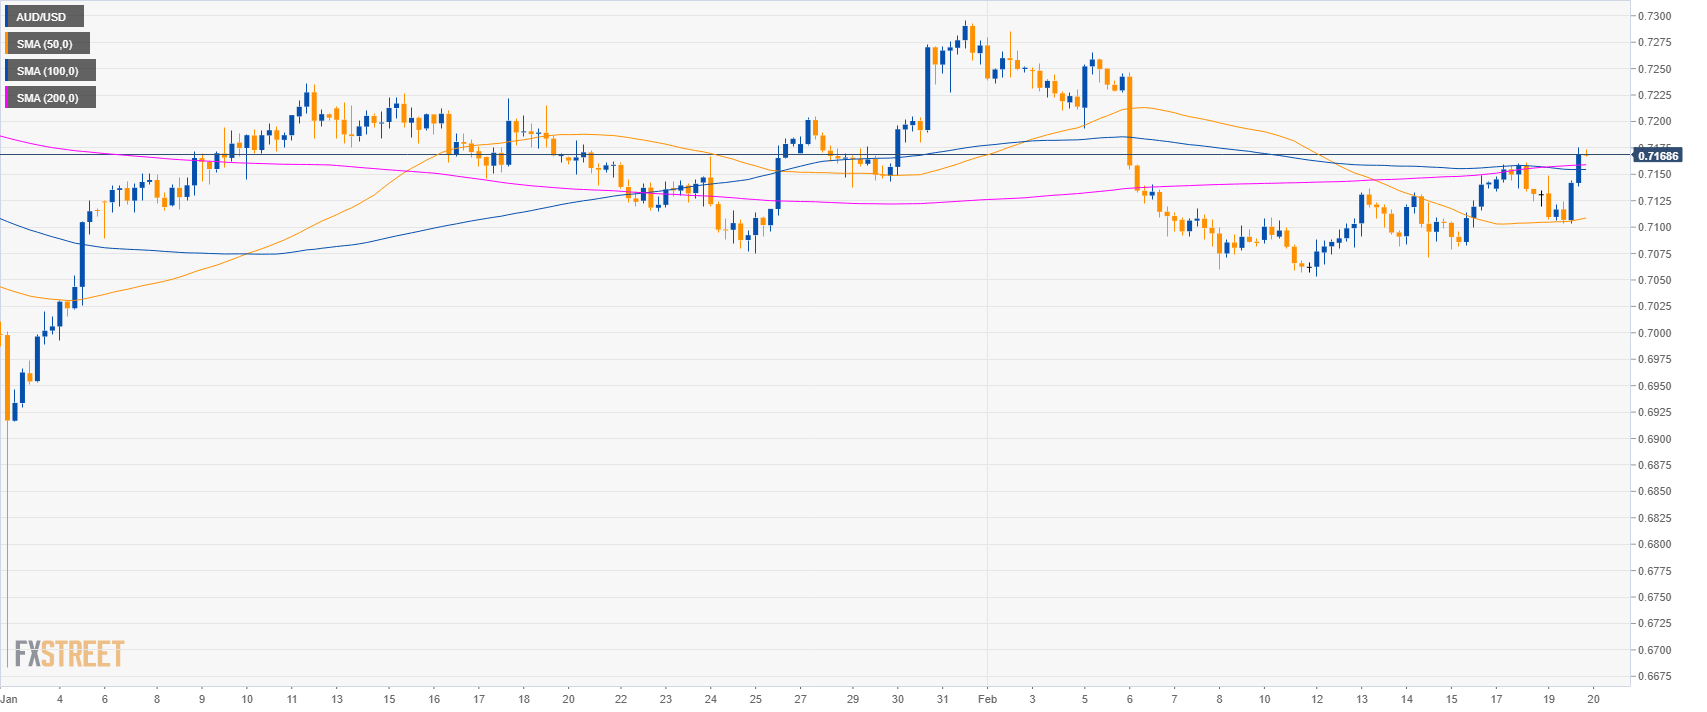
AUD/USD 4-hour chart
- AUD/USD is trading above its main SMAs suggesting bullish momentum.
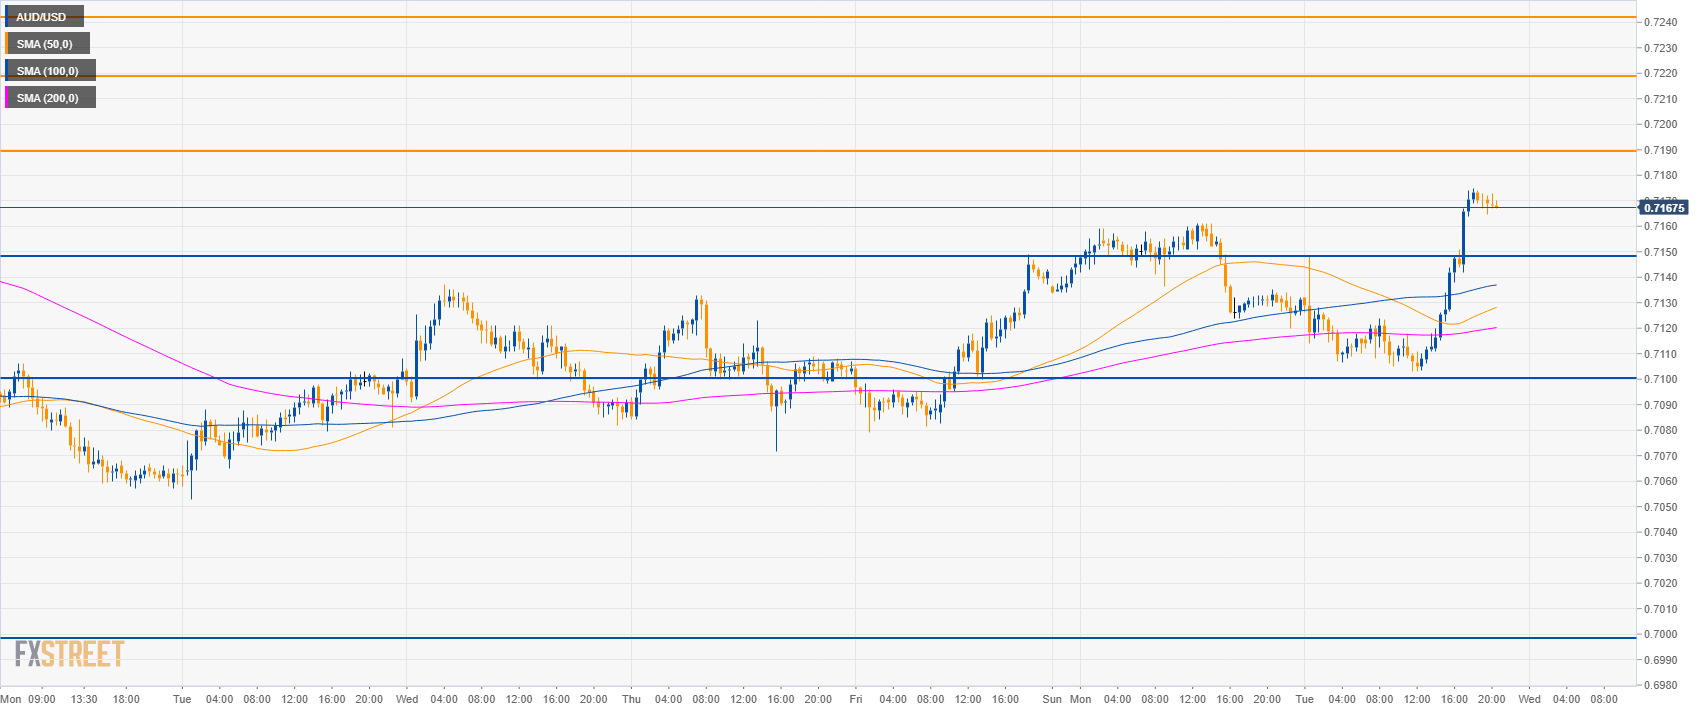
AUD/USD 30-minute chart
- As discussed yesterday, the Aussie declined to the 0.7100 figure to then pick up pace towards our target which remains at 0.7240.
- Support is at 0.7150 and 0.7100 level.
Additional key levels
AUD/USD
Overview:
Today Last Price: 0.7168
Today Daily change: 35 pips
Today Daily change %: 0.49%
Today Daily Open: 0.7133
Trends:
Daily SMA20: 0.7151
Daily SMA50: 0.7137
Daily SMA100: 0.7161
Daily SMA200: 0.7271
Levels:
Previous Daily High: 0.7161
Previous Daily Low: 0.7124
Previous Weekly High: 0.7149
Previous Weekly Low: 0.7053
Previous Monthly High: 0.7296
Previous Monthly Low: 0.6684
Daily Fibonacci 38.2%: 0.7138
Daily Fibonacci 61.8%: 0.7147
Daily Pivot Point S1: 0.7118
Daily Pivot Point S2: 0.7102
Daily Pivot Point S3: 0.7081
Daily Pivot Point R1: 0.7155
Daily Pivot Point R2: 0.7176
Daily Pivot Point R3: 0.7192