Back
21 Feb 2019
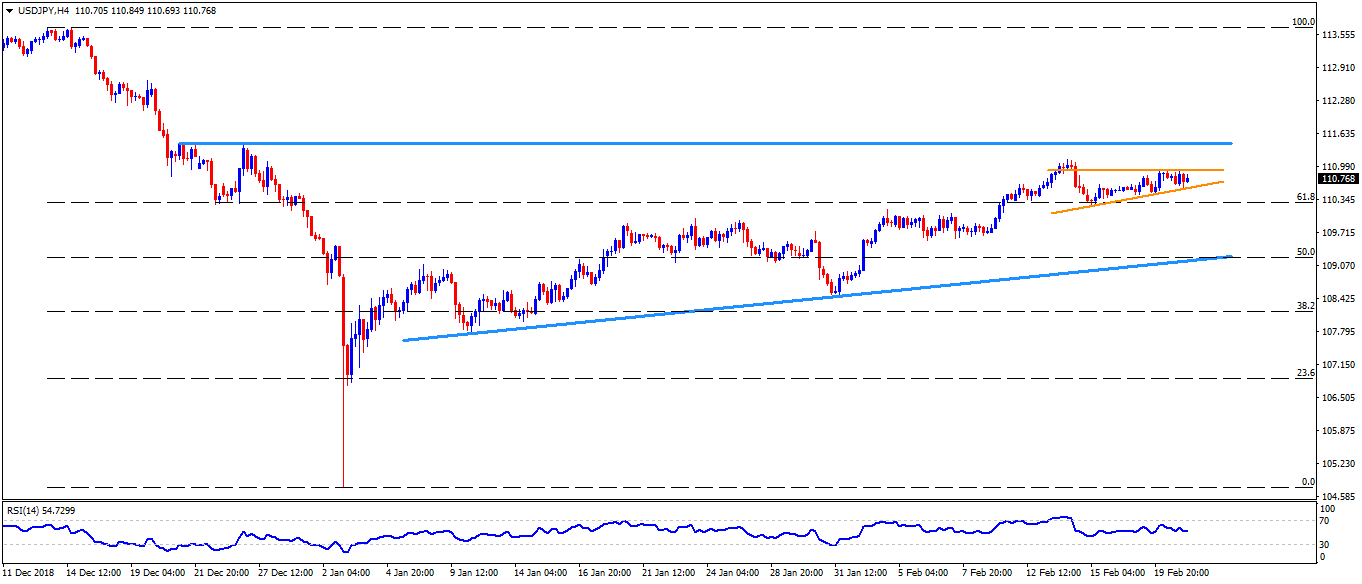
USD/JPY Technical Analysis: Immediate ascending triangle confines the pair moves between 110.95 and 110.50
- The Japanese Yen (JPY) trade near 110.80 against the USD during early Thursday.
- The pair moves have been challenged by the short-term ascending triangle present between 110.95 resistance and 110.50 support.
- Should the pair rallies beyond 110.95 resistance-line connecting present week high to the late February 14 lows, 111.15 and 111.45-50 could quickly appear on the chart.
- In a case prices rally beyond 111.50, 112.10 and 112.60 might please the buyers ahead of challenging them with 113.10 and 113.70 resistances.
- On the contrary, a downside break of 110.50 highlights the importance of 110.00 whereas 109.50 could entertain sellers then after.
- However, an upward sloping support-line joining January 10 and 31 low, at 109.10, may limit the pair’s declines past-109.50.
- Given the bears’ rule trade sentiment under 109.10, 108.50 and 107.70 could flash on their radar to target.
USD/JPY 4-Hour chart
Additional important levels:
Overview:
Today Last Price: 110.74
Today Daily change: 10 pips
Today Daily change %: -0.09%
Today Daily Open: 110.84
Trends:
Daily SMA20: 109.98
Daily SMA50: 110.01
Daily SMA100: 111.51
Daily SMA200: 111.31
Levels:
Previous Daily High: 110.96
Previous Daily Low: 110.54
Previous Weekly High: 111.13
Previous Weekly Low: 109.7
Previous Monthly High: 110
Previous Monthly Low: 104.75
Daily Fibonacci 38.2%: 110.79
Daily Fibonacci 61.8%: 110.7
Daily Pivot Point S1: 110.6
Daily Pivot Point S2: 110.36
Daily Pivot Point S3: 110.18
Daily Pivot Point R1: 111.02
Daily Pivot Point R2: 111.2
Daily Pivot Point R3: 111.44