Gold technical analysis: Further selling can be expected below $1,437 as bulls lose momentum
- Key technical indicators show Gold loses momentum.
- Sellers await the break of immediate support-line.
- $1,417.80/$1,418 region limits nearby advances.
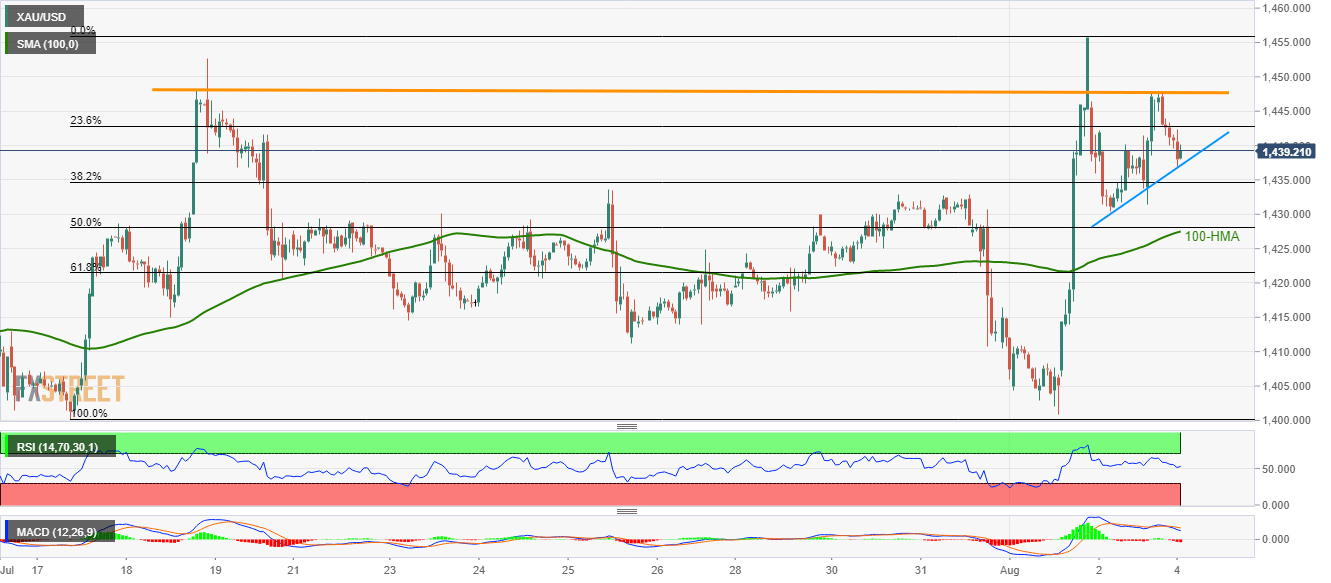
With the short-term horizontal resistance aptly limiting Gold’s near-term upside, coupled with downward sloping technical indicators, the yellow metal is likely weak around $1,439 at the Monday morning in Asia.
Sellers targeting 100-hour moving average (HMA) level of $1,427.50 are waiting for a break of immediate ascending trend-line, at $1,437.
However, the precious metal’s further declines will be challenged by 61.8% Fibonacci retracement of mid-July to early month rise, at $1,421.50, and July 25 low near $1,411.
Supporting the bears are a downward sloping pattern of the 14-bar relative strength index (RSI) and 12-bar moving average convergence and divergence (MACD) technical indicators.
Alternatively, a horizontal area between $1,417.80 and $1,418 can keep buyers in check, a break of which will trigger the upside towards the recent high of $1,455.80.
Gold hourly chart
Trend: Pullback expected