USD/INR technical analysis: Break of short-term falling trendline will renew buyer’s strength
- USD/INR keeps bouncing off 100-day EMA ever since it crossed the key EMA in early August.
- A downside break will shift sellers’ attention to 70.36/35 support-zone.
Although the USD/INR pair is heading negative for a third consecutive day, pair’s repeated bounce off the 100-day Exponential Moving Average (EMA) seems to keep the buyers hopeful. The pair trades around 70.73 while heading into the European open on Tuesday.
With the repeated pullbacks from the key EMA, buyers will look for a clear break of a descending trend-line since mid-October, at 71.06 now, to renew pair’s recovery towards 23.6% Fibonacci retracement of July-September advances, at 71.60.
In case prices manage to rise past-71.60, 72.00, 72.35 and September high around 72.65 will be in the spotlight.
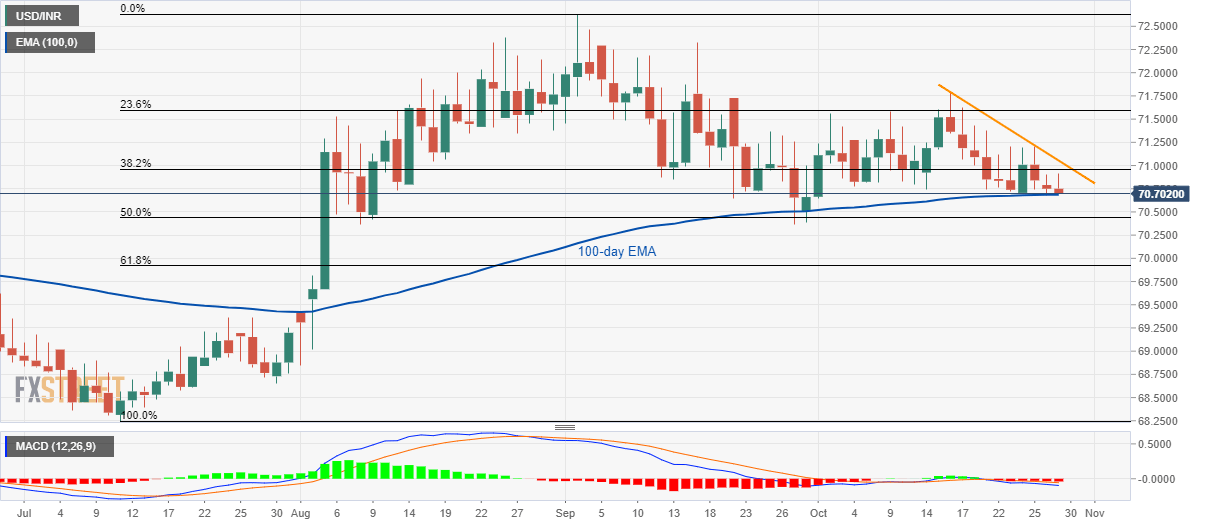
On the downside, a clear break below 70.68, comprising 100-day EMA, will divert bears towards 70.36/35 region including lows marked since August 08.
USD/INR daily chart
Trend: pullback expected