Back
7 Nov 2019
GBP/JPY Technical Analysis: Drops to 1-week-low, 21-day SMA question sellers
- GBP/JPY extends pullback from a fortnight top.
- 61.8% Fibonacci retracement, 200-day SMA offer support.
- 141.50/75 could gain bull’s attention while rising beyond October top.
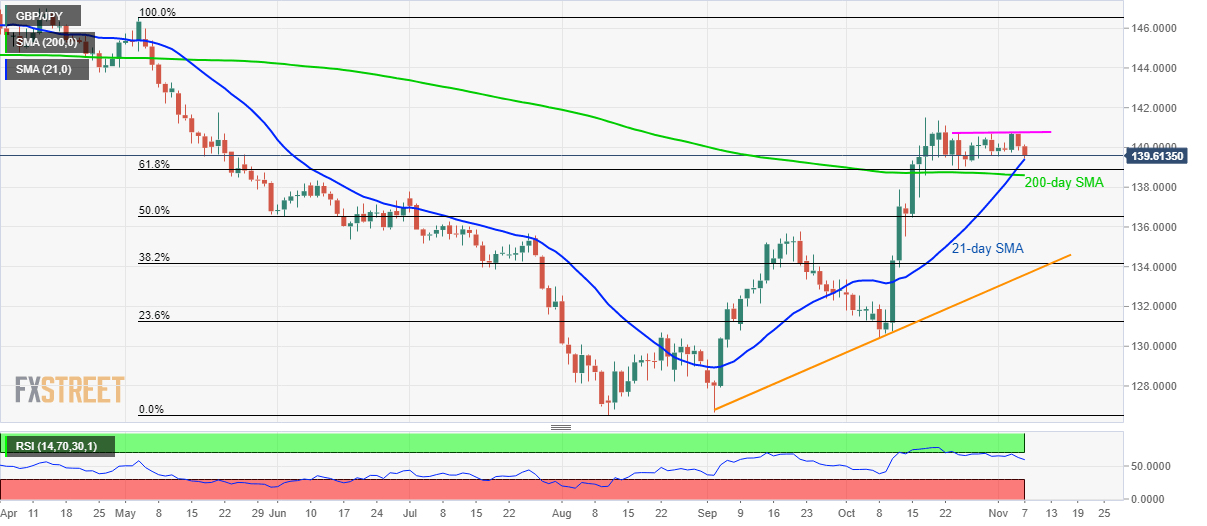
A failure to provide an upside break of the trading range since October 24 drags GBP/JPY to 21-day SMA while taking rounds to 139.60 ahead of the UK open on “Super Thursday.”
While the 21-day Simple Moving Average (SMA) level of 139.42 seems to limit pair’s immediate declines, 61.8% Fibonacci retracement of May-August declines and 200-day SMA could question bears around 138.90/60 area.
If prices fail to respect the key support zone, July month top of 137.80 and 50% Fibonacci retracement level of 136.53 could lure pessimists.
On the upside, 140.75/80 could keep the quote in checks during its U-turn ahead of highlighting October high of 141.50/75 region including October and late-May highs to buyers.
GBP/JPY daily chart
Trend: pullback expected