Back
22 Nov 2019
USD/JPY Technical Analysis: Break to 109.00 handle still on the cards
- USD/JPY is entering the Asian session near daily highs.
- The level to beat for buyers is the 108.73 resistance.
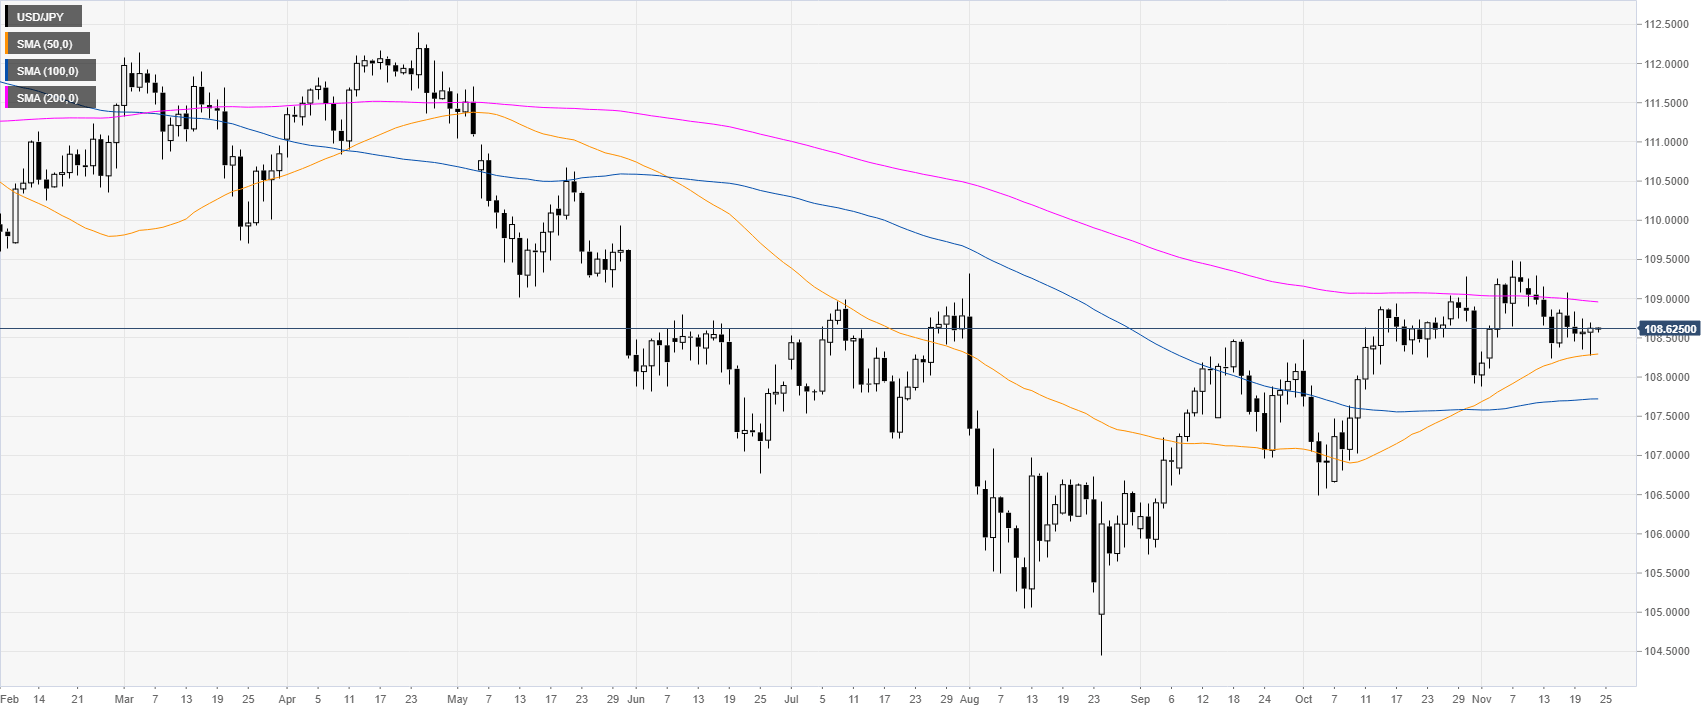
USD/JPY daily chart
USD/JPY is trading above the 108.00 handle and the 50-day simple moving average (DMA) on the daily time frame. Over the last 2.5 months, the spot has been gradually gaining ground.
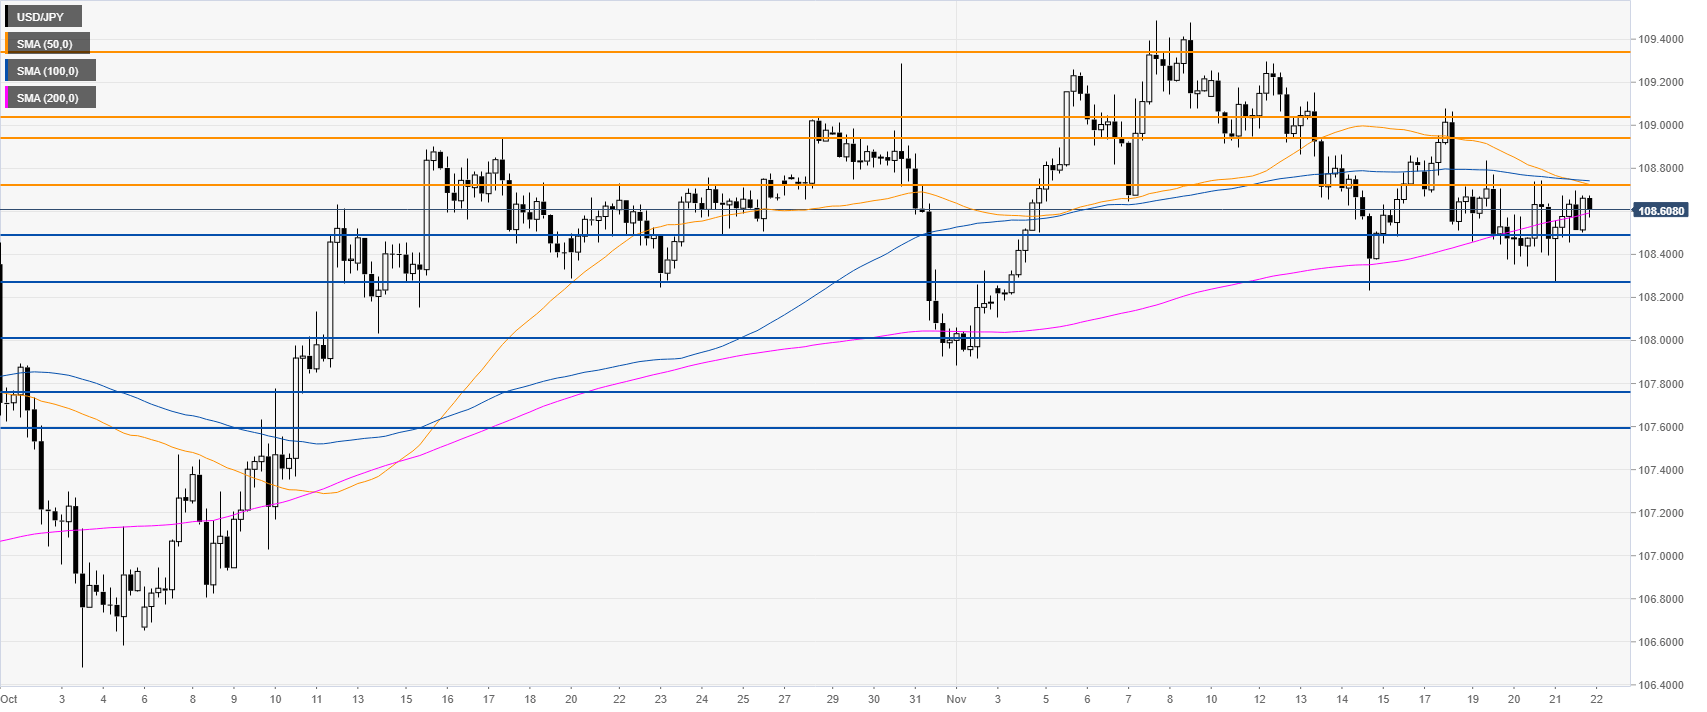
USD/JPY four-hour chart
USD/JPY is holding above the 108.50 support level and the 200 SMA. A breakout above the 108.73 level can lead to a potential bullish move towards the 108.94/109.05 resistance zone, according to the Technical Confluences Indicator.
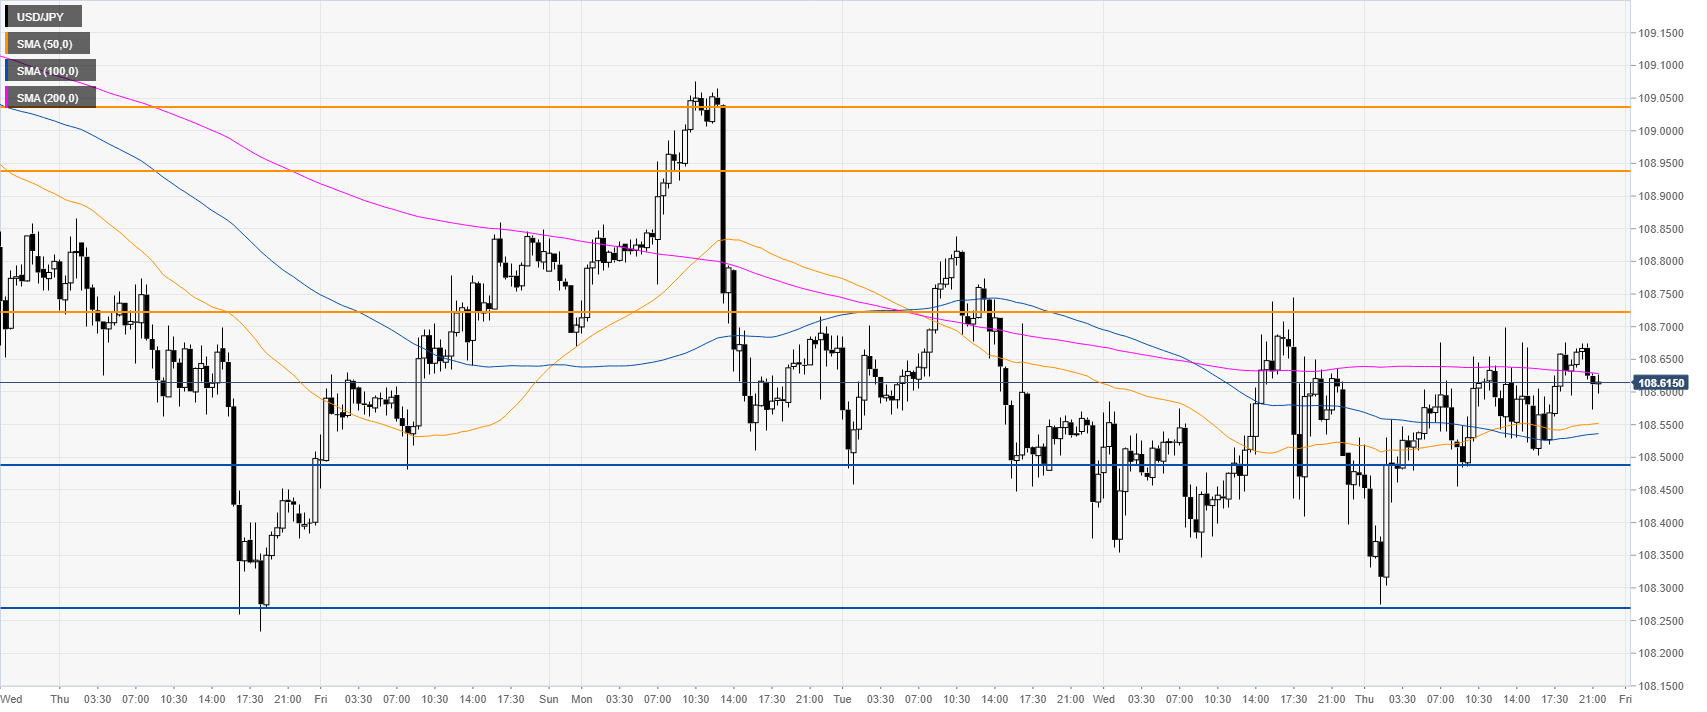
USD/JPY 30-minute chart
USD/JPY is trading in a range near a flat 200 SMA on the 30-minute chart. Support is seen at the 108.50 and 108.27 levels, according to the Technical Confluences Indicator.
Additional key levels