Confirming you are not from the U.S. or the Philippines

یہ بیان دے کر، میں واضح طور پر یہ بتاتا اور تصدیق کرتا ہوں کہ:
  • میں امریکی شہری یا رہائشی نہیں ہوں
  • میں فلپائن کا رہائشی نہیں ہوں
  • میں بالواسطہ یا بلاواسطہ امریکی باشندوں کے 10 فیصد سے زیادہ شیئرز/ ووٹنگ کا حق/ امریکی باشندوں کے انٹرسٹ کا مالک نہیں ہوں اور/یا دوسرے ذرائع سے امریکی شہریوں یا رہائشیوں کو کنٹرول نہیں کرتا ہوں۔
  • میں بالواسطہ یا بلاواسطہ امریکی باشندوں کے 10 فیصد سے زیادہ شیئرز/ ووٹنگ کا حق/ انٹرسٹ کا مالک نہیں ہوں اور/ یا کسی دوسرے ذریعے سے امریکی شہری یا رہائشی کے کنٹرول میں نہیں ہوں۔
  • میں FATCA کے سیکشن (a)1504 کے معاملے میں امریکی شہریوں یا رہائشیوں کے ساتھ وابستہ نہیں ہوں
  • میں غلط اعلان کرنے پر اپنی ذمہ داری سے واقف ہوں۔
اس بیان کے مقاصد کے لئے، ریاستہائے متحدہ امریکہ کے تمام منحصر ممالک اور علاقوں کو امریکہ کے مرکزی علاقے کے برابر کردیا گیا ہے۔ میں اپنے اس بیان کی خلاف ورزی سے پیدا ہونے یا اس سے متعلق ہونے والے کسی بھی دعوے کے خلاف، بے ضرر آکٹا مارکیٹس انکارپوریٹڈ، اس کے ڈائریکٹرز اور افسران کا دفاع کرنے کا عہد کرتا ہوں۔
ہم آپ کی رازداری اور آپ کی ذاتی معلومات کے تحفظ کے لیے وقف ہیں۔ ہم محض اپنی پراڈکٹس اور سروسز کے متعلق خصوصی پیشکشوں اور اہم معلومات فراہم کرنے کے لیے ای میلز اکٹھا کرتے ہیں۔ اپنا ای میل ایڈریس دے کر، آپ ہم سے ایسے ای میلز وصول کرنے پر اتفاق کرتے ہیں۔ اگر آپ انسبسکرائب کرنا چاہتے ہیں یا کوئی سوالات یا خدشات ہوں تو، ہماری کسٹمر سپورٹ کو لکھیں۔
Back

WTI Technical Analysis: Fails to extend the bounce off 200-bar SMA, 61.8% Fibonacci

  • WTI stays mildly bid after the recent recovery.
  • Bearish MACD, a sluggish strength of pullback could favor the Bears.
  • Buyers will look for entry beyond the short-term support-turned-resistance area.

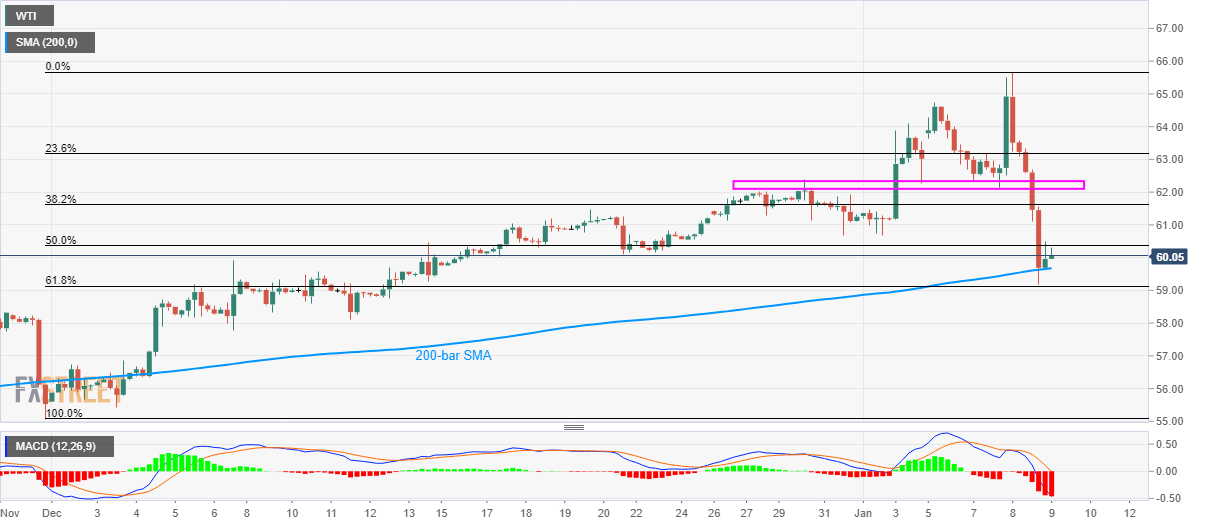
WTI seesaws around $60.10/15 during early Thursday. The black gold recently bounced off 61.8% Fibonacci retracement of November 29 low to Wednesday’s high as well as cleared 200-bar SMA. Even so, bearish signals from MACD and a soft recovery portray underlying weakness in the momentum.

As a result, sellers will be on the lookout of entry below the key Fibonacci retracement level of $59.10. Though, 200-bar SMA around $59.70 can be considered as immediate support.

If at all the black gold slips below $59.10, also smash $59.00 round-figure, December 06 low near $57.77 and December 06 high near $56.70 will return to the charts.

Assuming oil price recovery, lows marked during last-week around $60.70 can act as the adjacent resistance ahead of the $62.10/35 area comprising December-end top and lows marked on January 03 and 07.

However, the commodity’s successful rally past-$62.35 enables it to challenge the latest top of $65.67 while targeting $66.00 during further upside.

WTI four-hour chart
Trend: Pullback expected


Iran’s response to the US attack underlines its capacity for careful calculation - FT

Markets remain on red alert. There is a sense we have not seen the back of the conflict in the Persian Gulf. In a denouement to the events that took p
مزید پڑھیں Previous

Gold draws bids as US yields drop

Gold is looking to regain poise in Asia with US treasury yields flashing losses. The yellow metal is currently trading at $1,560 per Oz, representing
مزید پڑھیں Next