Confirming you are not from the U.S. or the Philippines

یہ بیان دے کر، میں واضح طور پر یہ بتاتا اور تصدیق کرتا ہوں کہ:
  • میں امریکی شہری یا رہائشی نہیں ہوں
  • میں فلپائن کا رہائشی نہیں ہوں
  • میں بالواسطہ یا بلاواسطہ امریکی باشندوں کے 10 فیصد سے زیادہ شیئرز/ ووٹنگ کا حق/ امریکی باشندوں کے انٹرسٹ کا مالک نہیں ہوں اور/یا دوسرے ذرائع سے امریکی شہریوں یا رہائشیوں کو کنٹرول نہیں کرتا ہوں۔
  • میں بالواسطہ یا بلاواسطہ امریکی باشندوں کے 10 فیصد سے زیادہ شیئرز/ ووٹنگ کا حق/ انٹرسٹ کا مالک نہیں ہوں اور/ یا کسی دوسرے ذریعے سے امریکی شہری یا رہائشی کے کنٹرول میں نہیں ہوں۔
  • میں FATCA کے سیکشن (a)1504 کے معاملے میں امریکی شہریوں یا رہائشیوں کے ساتھ وابستہ نہیں ہوں
  • میں غلط اعلان کرنے پر اپنی ذمہ داری سے واقف ہوں۔
اس بیان کے مقاصد کے لئے، ریاستہائے متحدہ امریکہ کے تمام منحصر ممالک اور علاقوں کو امریکہ کے مرکزی علاقے کے برابر کردیا گیا ہے۔ میں اپنے اس بیان کی خلاف ورزی سے پیدا ہونے یا اس سے متعلق ہونے والے کسی بھی دعوے کے خلاف، بے ضرر آکٹا مارکیٹس انکارپوریٹڈ، اس کے ڈائریکٹرز اور افسران کا دفاع کرنے کا عہد کرتا ہوں۔
ہم آپ کی رازداری اور آپ کی ذاتی معلومات کے تحفظ کے لیے وقف ہیں۔ ہم محض اپنی پراڈکٹس اور سروسز کے متعلق خصوصی پیشکشوں اور اہم معلومات فراہم کرنے کے لیے ای میلز اکٹھا کرتے ہیں۔ اپنا ای میل ایڈریس دے کر، آپ ہم سے ایسے ای میلز وصول کرنے پر اتفاق کرتے ہیں۔ اگر آپ انسبسکرائب کرنا چاہتے ہیں یا کوئی سوالات یا خدشات ہوں تو، ہماری کسٹمر سپورٹ کو لکھیں۔
Back

USD/JPY Technical Analysis: Weekly close beyond 109.70/75 will be a call to bulls

  • USD/JPY trades positive near the two-week high, on a five-day winning streak.
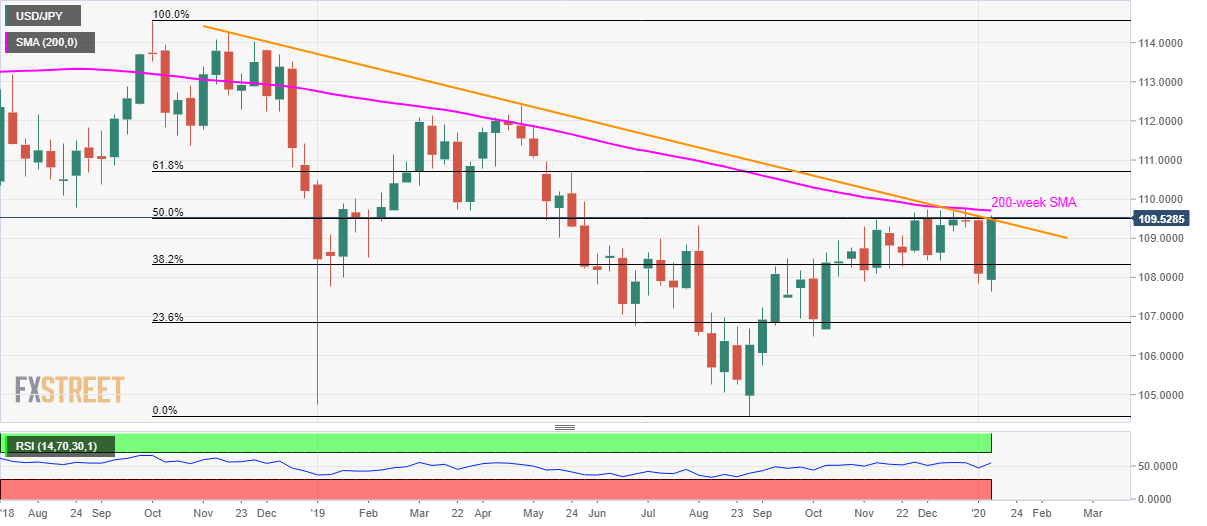
  • Bullish engulfing on the weekly chart confronts 109.48/52 resistance confluence.
  • 200-week SMA adds to the resistance.

USD/JPY takes the bids to 109.55 during the initial trading session on Friday. In doing so, the pair registers a bullish candlestick formation on the weekly chart that currently confronts the key resistance confluence.

In addition to 109.48/52 area including 50% Fibonacci retracement of October 2018 top to August 2019 low and a downward sloping trend line since November 2018, 200-week SMA around 109.70/75 also challenges the buyers.

If at all USD/JPY prices register a weekly closing beyond 109.75, it confirms the bullish engulfing candlestick pattern on the chart while also the bulls to aim for the late-May top near 110.00.

Following that, 61.8% Fibonacci retracement level of 110.70 and April 2019 high of 112.40 will lure the buyers.

On the downside, pair’s declines below 108.45/40 hold the key to 108.00 and 107.50 support levels. However, the pair’s drop beneath 107.50 might not refrain from dragging the quote to the sub-107.00 region.

USD/JPY weekly chart
Trend: Bullish


BI Survey: Indonesia's Retail Sales rise 1.3% YoY in Nov, Rupiah at 21-month highs

Indonesia's Retail Sales grew by 1.3% on the year in November vs. a 3.6% jump seen in October, the latest survey conducted by Bank Indonesia (BI), the
مزید پڑھیں Previous

India: Increase in headline inflation to bring an end to easing cycle – Capital Economics

In their latest client note, analysts at Capital Economics note that India’s headline retail inflation likely accelerated to a five-year high in Decem
مزید پڑھیں Next