Confirming you are not from the U.S. or the Philippines

یہ بیان دے کر، میں واضح طور پر یہ بتاتا اور تصدیق کرتا ہوں کہ:
  • میں امریکی شہری یا رہائشی نہیں ہوں
  • میں فلپائن کا رہائشی نہیں ہوں
  • میں بالواسطہ یا بلاواسطہ امریکی باشندوں کے 10 فیصد سے زیادہ شیئرز/ ووٹنگ کا حق/ امریکی باشندوں کے انٹرسٹ کا مالک نہیں ہوں اور/یا دوسرے ذرائع سے امریکی شہریوں یا رہائشیوں کو کنٹرول نہیں کرتا ہوں۔
  • میں بالواسطہ یا بلاواسطہ امریکی باشندوں کے 10 فیصد سے زیادہ شیئرز/ ووٹنگ کا حق/ انٹرسٹ کا مالک نہیں ہوں اور/ یا کسی دوسرے ذریعے سے امریکی شہری یا رہائشی کے کنٹرول میں نہیں ہوں۔
  • میں FATCA کے سیکشن (a)1504 کے معاملے میں امریکی شہریوں یا رہائشیوں کے ساتھ وابستہ نہیں ہوں
  • میں غلط اعلان کرنے پر اپنی ذمہ داری سے واقف ہوں۔
اس بیان کے مقاصد کے لئے، ریاستہائے متحدہ امریکہ کے تمام منحصر ممالک اور علاقوں کو امریکہ کے مرکزی علاقے کے برابر کردیا گیا ہے۔ میں اپنے اس بیان کی خلاف ورزی سے پیدا ہونے یا اس سے متعلق ہونے والے کسی بھی دعوے کے خلاف، بے ضرر آکٹا مارکیٹس انکارپوریٹڈ، اس کے ڈائریکٹرز اور افسران کا دفاع کرنے کا عہد کرتا ہوں۔
ہم آپ کی رازداری اور آپ کی ذاتی معلومات کے تحفظ کے لیے وقف ہیں۔ ہم محض اپنی پراڈکٹس اور سروسز کے متعلق خصوصی پیشکشوں اور اہم معلومات فراہم کرنے کے لیے ای میلز اکٹھا کرتے ہیں۔ اپنا ای میل ایڈریس دے کر، آپ ہم سے ایسے ای میلز وصول کرنے پر اتفاق کرتے ہیں۔ اگر آپ انسبسکرائب کرنا چاہتے ہیں یا کوئی سوالات یا خدشات ہوں تو، ہماری کسٹمر سپورٹ کو لکھیں۔
Test
Back

GBP/JPY Price Analysis: Sustained break of 144.00 highlights monthly resistance trendline

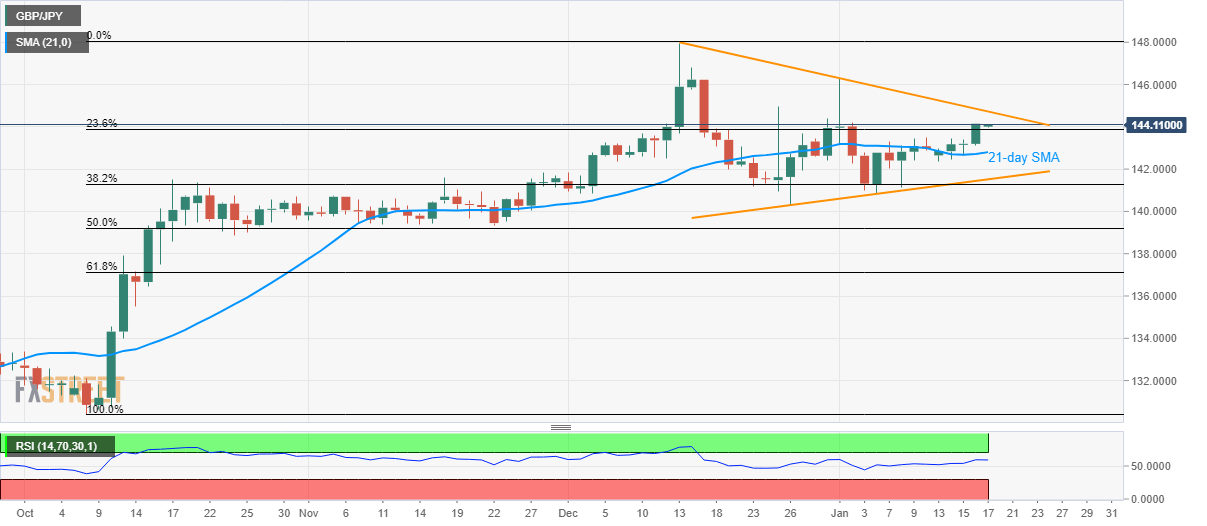
  • GBP/JPY seesaws near the two-week top, extends run-up beyond 23.6% Fibonacci retracement of the pair’s October-December 2019 upside.
  • A downside break will have a 21-day SMA and support-line of the short-term triangle as challenging the bears.

GBP/JPY takes the bids to 144.15 during Friday’s Asian session. The pair stays positive above 23.6% Fibonacci retracement of the pair’s October-December 2019 upside, which in turn shifts buyers’ focus to a downward sloping trend line stretched from December 13.

Should prices stay strong beyond 144.75 level comprising the aforementioned resistance-line, the yearly top surrounding 146.30 will return to the chart.

In a case where the bulls keep dominating past-146.30, 146.80 and 148.00 could offer intermediate halts during the rise to 150.00 psychological mark.

Meanwhile, a downside break of 23.6% Fibonacci retracement, at 143.85, can fetch the quote back to 21-day SMA, at 142.80 now.

Though, a three-week-old rising trend line and 38.2% Fibonacci retracement could challenge the bears amid the following declines around 141.50 and 141.30 respectively.

GBP/JPY daily chart
Trend: Bullish


Gold: On the back foot below 10-day SMA amid broad USD strength, risk-on

Gold prices seesaw near $1,552 during Friday’s early Asian session. The yellow metal dropped the previous day, closed below 10-day SMA.
مزید پڑھیں Previous

When is China’s data dump and how could it affect the AUD/USD?

Early Friday, the market sees the fourth quarter (Q4) GDP and annualized figures of December month Retail Sales and Industrial Production from China.
مزید پڑھیں Next