Back
17 Mar 2020
Silver Price Analysis: XAG/USD under heavy pressure in 11-year lows
- XAG/USD is trading near its lowest point since 2009.
- The level to beat for sellers is the 12.00 support.
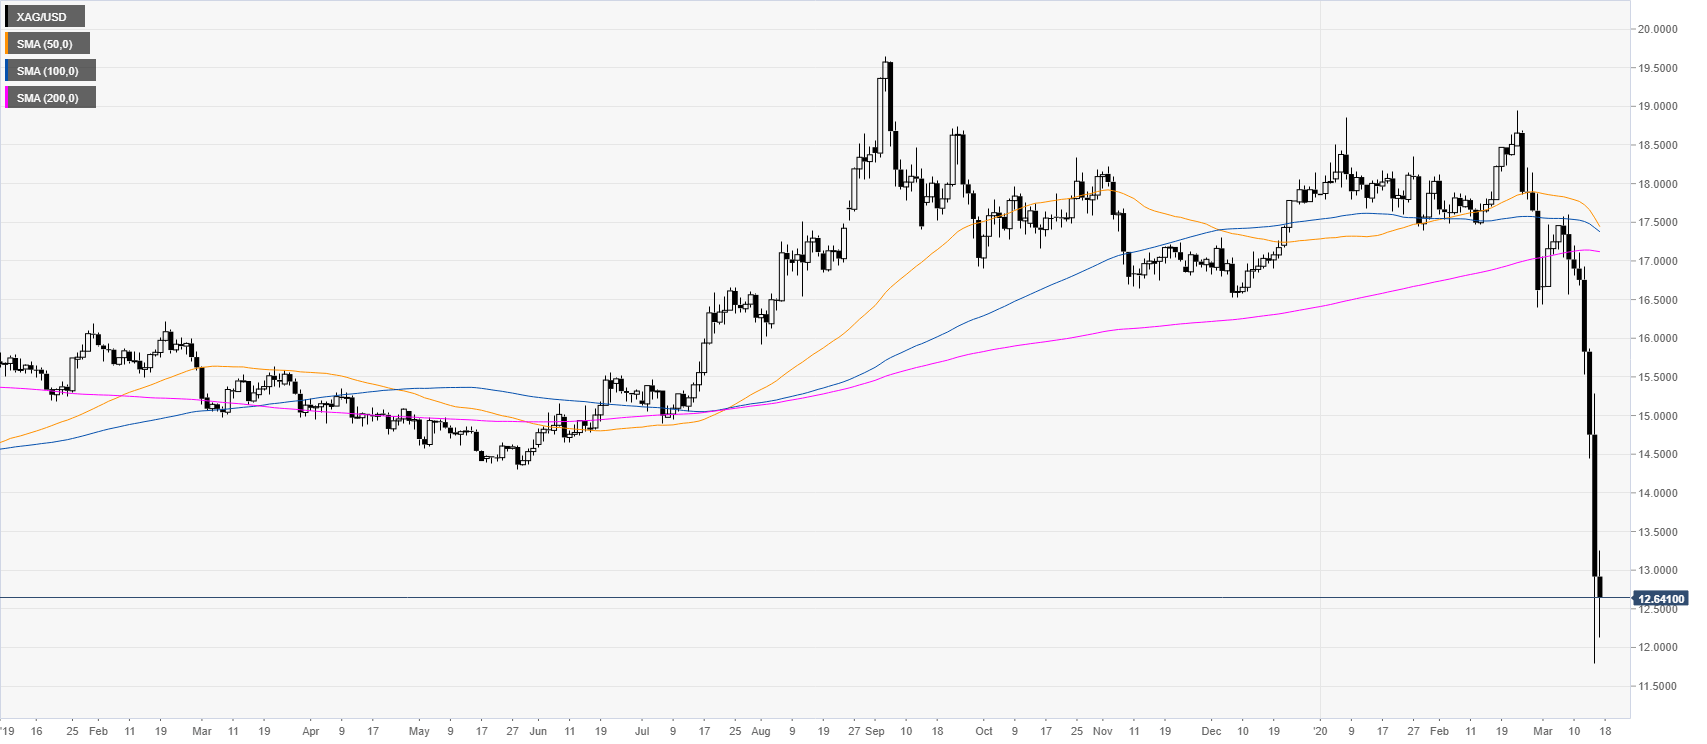
Silver daily chart
After the dramatic drop to 2009 low, XAG/USD is consolidating below the 13.00 figure. However, the metal remains vulnerable to a new wave of selling.
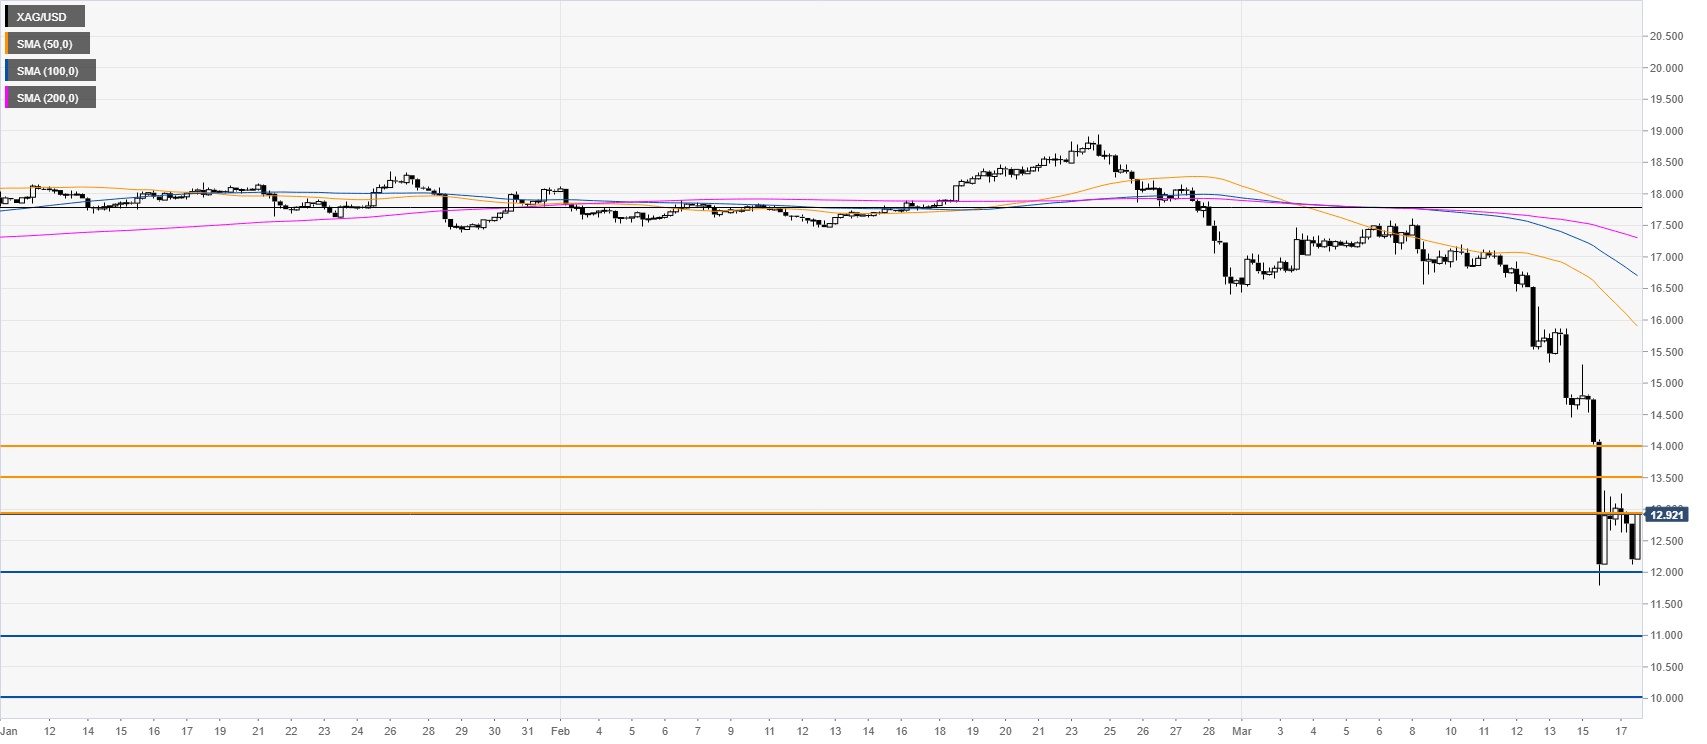
Silver four-hour chart
Silver is trading well below its main SMAs as bears stay in control. As the market is consolidating losses, a break below the 12.00 figure can extend the bear leg to 11.00 and 10.00 price levels. Conversely, resistance is seen near the 13.00, 13.50 and 14.00 levels.
Resistance: 13.00, 13.50, 14.00
Support: 12.00, 11.00, 10.00
Additional key levels