Back
21 Apr 2020
Silver Price Analysis: XAG/USD falls below $15.00/oz
- XAG/USD takes a hit a drops below the 15.00 mark.
- Support is seen near 14.50 and $13.90/oz.
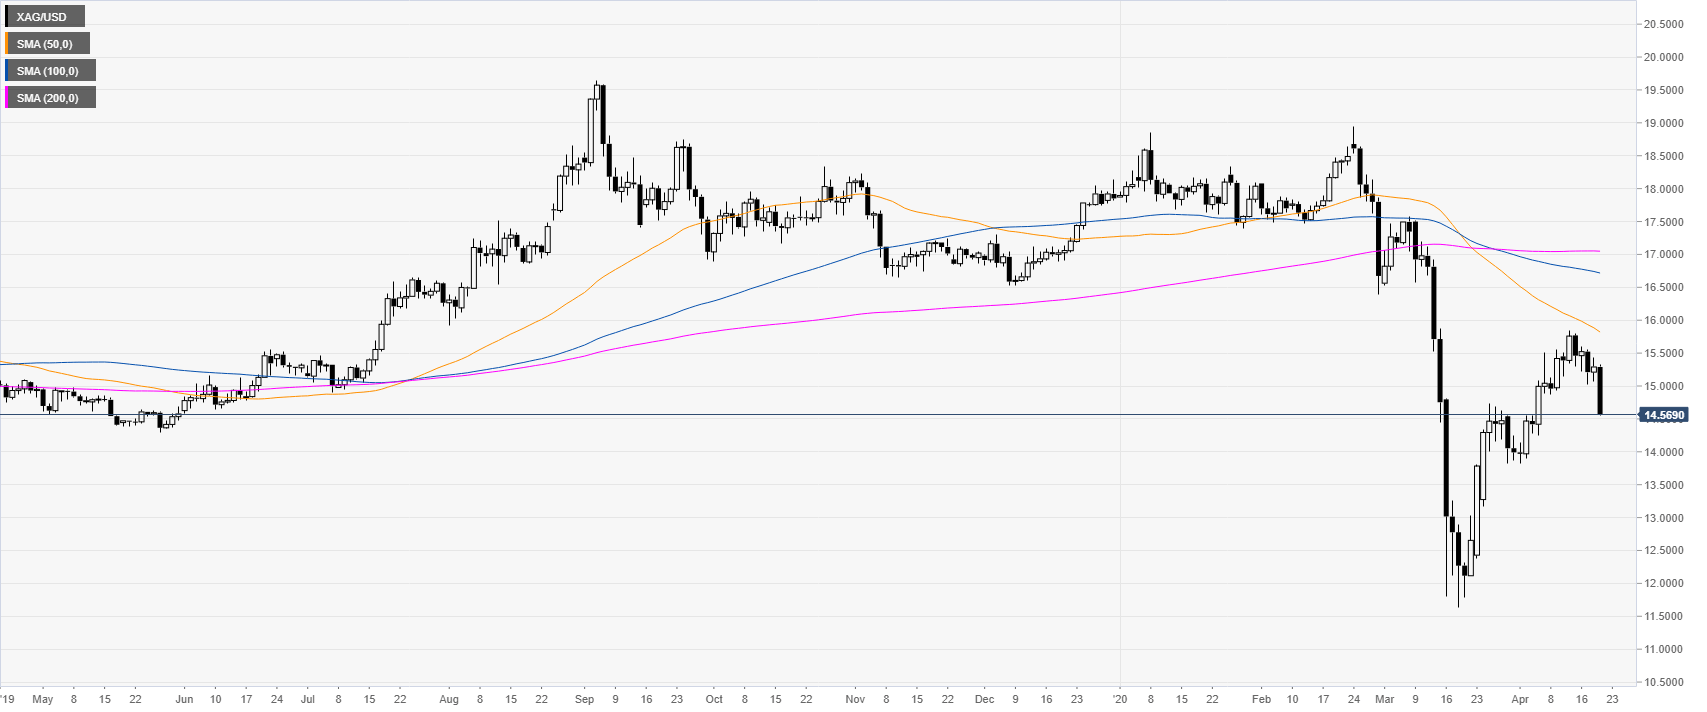
Silver daily chart
XAG/USD is retracing down after the sharp advance from mid-March. However, silver is trading below the main SMAs on the daily chart suggesting a bearish bias.
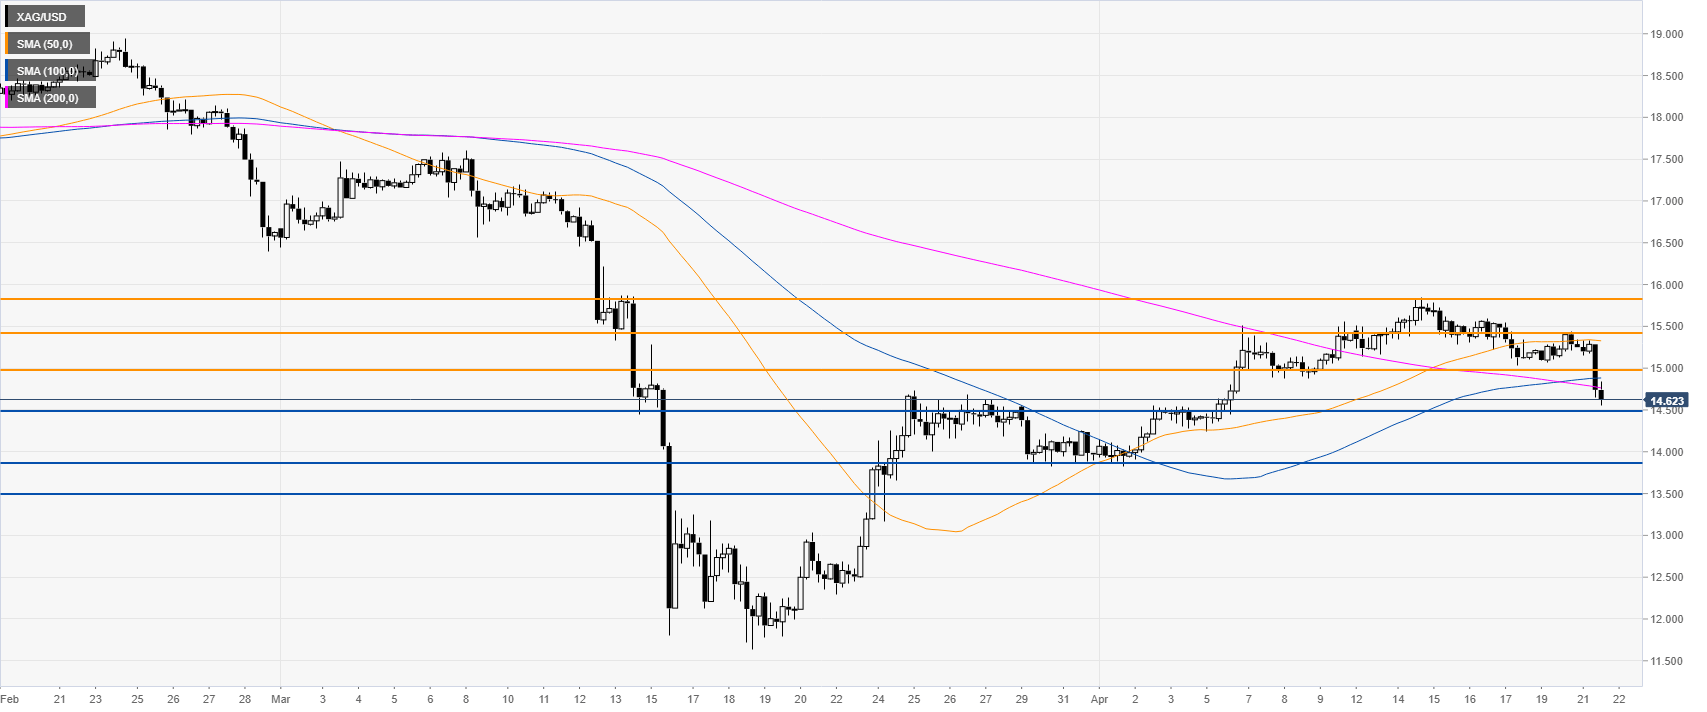
Silver four-hour chart
XAG/USD broke below the 15.00 mark and the main SMAs as bears hit the silver market. Sellers can try to break the 14.50 support level while bulls will try to hold the market above the 200 SMA for a return back above 15.00 which can act as resistance.
Resistance: 15.00, 15.43, 15.80
Support: 14.50, 13.90, 13.50
Additional key levels