Back
29 Apr 2020
Silver Price Analysis: XAG/USD sidelined above $15.00/oz ahead of FOMC
- XAG/USD recovery from the 2020 lows stays intact.
- The level to beat for bulls is the 15.43 level.
- Market participants are likely waiting for the FOMC later this Wednesday.
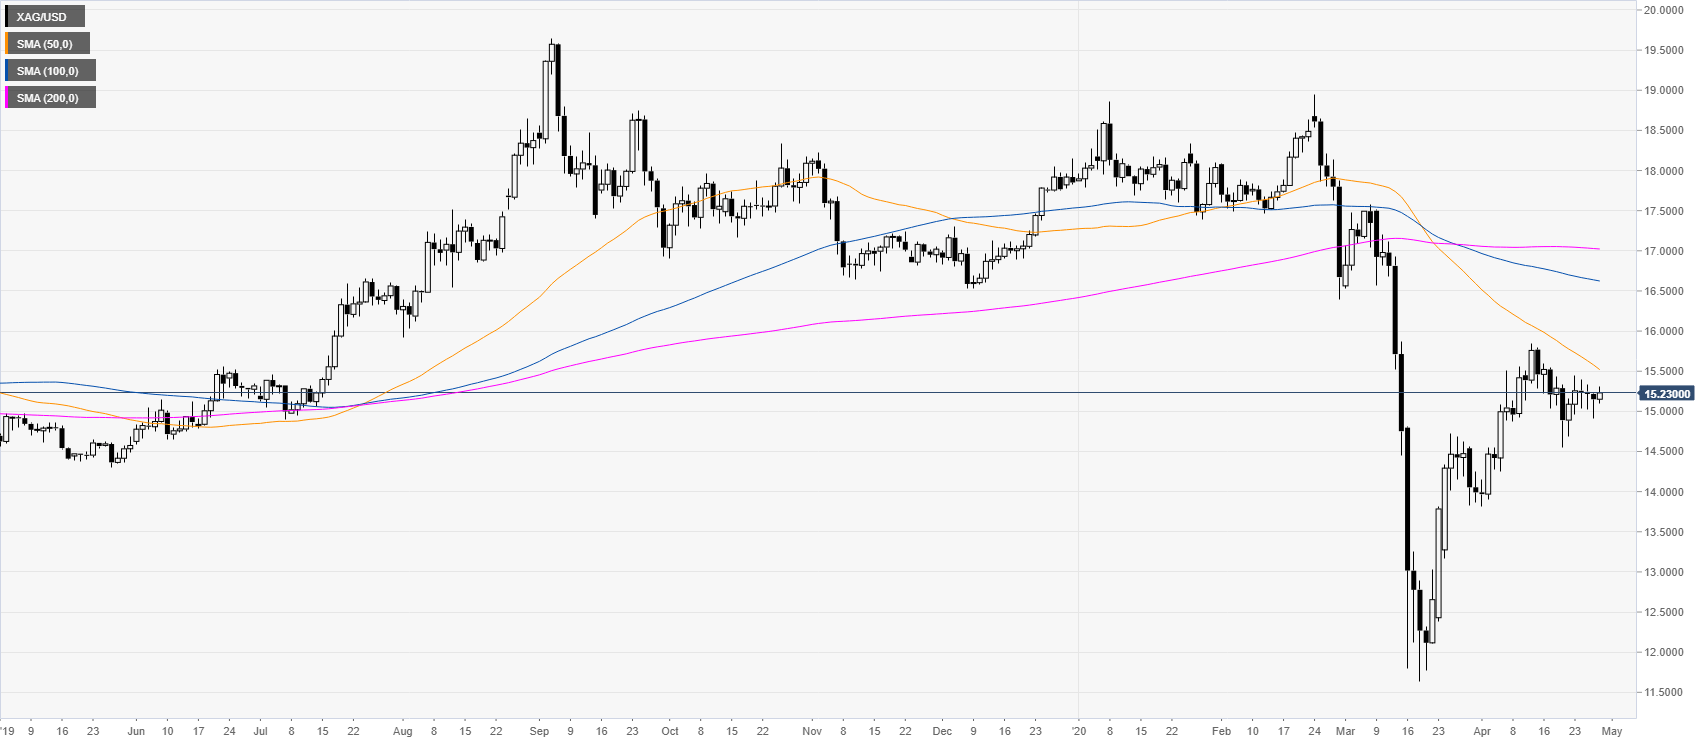
Silver daily chart
XAG/USD is consolidating the big bull-run from mid-March. However, silver remains below the main SMAs on the daily chart suggesting a negative bias in the long term but remains bullish in the medium-term. The FOMC projections this Wednesday are awaited by market players.
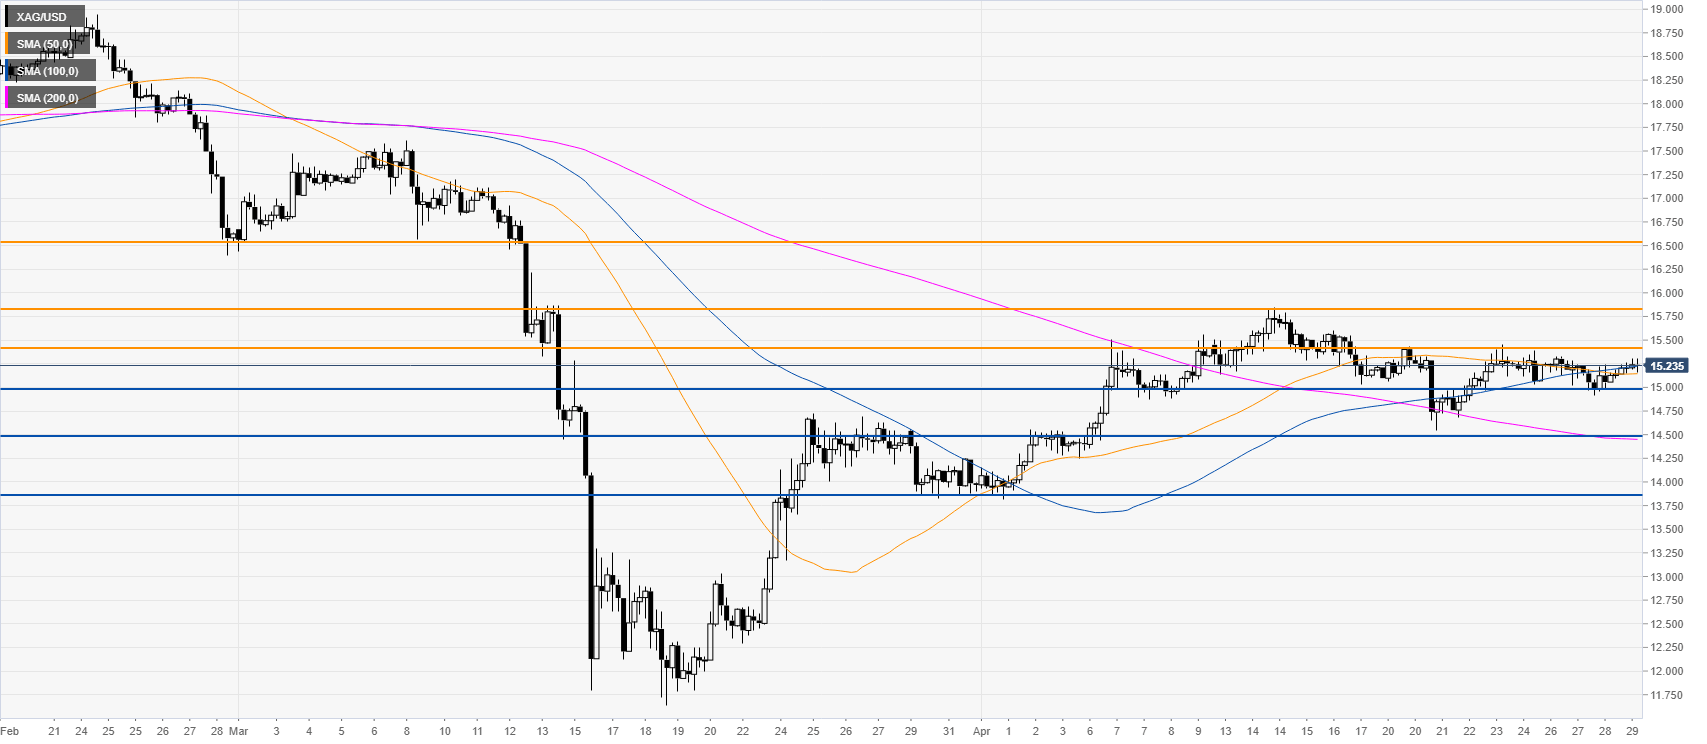
Silver four-hour chart
XAG/USD is sidelined above $15.00/oz near the 50 and 100 SMAs and while above the 200 SMA on the four-hour chart. The correction remains intact as bulls will be eyeing for a breakout beyond the 15.43 resistance en route towards the 15.85 and 16.50 levels on the way up. On the flip side, dips should meet support near 15.00 and 14.50 price levels.
Resistance: 15.43, 15.85, 16.50
Support: 15.00, 14.50, 13.90
Additional key levels