GBP/USD Price Analysis: Buyers struggle to find traction below 1.2500
- GBP/USD remains modestly bid after the previous day’s positive performance.
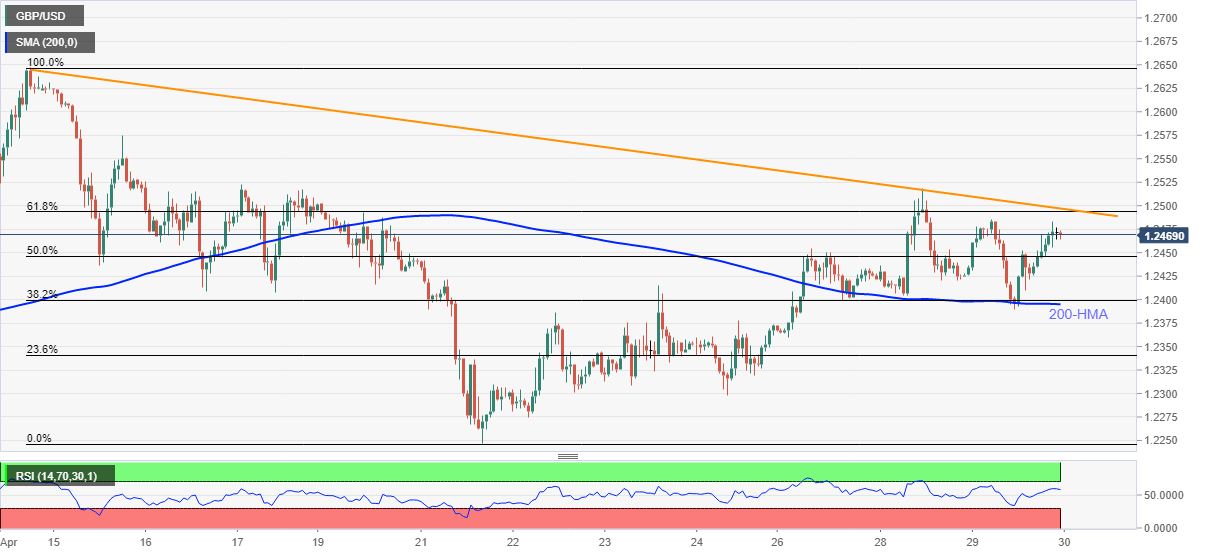
- A two-week-old resistance line, 61.8% Fibonacci retracement limit further upside.
- 200-HMA acts as the key support.
GBP/USD bulls are catching breath near 1.2470 amid the initial Asian session on Thursday. That said, the pair stays above 200-HMA, but still lacks the courage to cross 61.8% Fibonacci retracement level of April 14-21 fall and the short-term resistance line.
As a result, traders may find choppy moves between 1.2500 and 1.2395, signified by the aforementioned resistance line and 200-HMA respectively.
However, an intermediate pullback to 1.2445, comprising 50% Fibonacci retracement, can’t be ruled out.
It’s worth mentioning that the pair’s run-up beyond 1.2500 will have to refresh weekly high above 1.2520 to aim for the mid-month top surrounding 1.2575.
Alternatively, a downside break below 1.2395 can avail multiple supports around 1.2370 and 1.2340 ahead of visiting the 1.2300 round-figure.
GBP/USD hourly chart
Trend: Pullback expected