Confirming you are not from the U.S. or the Philippines

یہ بیان دے کر، میں واضح طور پر یہ بتاتا اور تصدیق کرتا ہوں کہ:
  • میں امریکی شہری یا رہائشی نہیں ہوں
  • میں فلپائن کا رہائشی نہیں ہوں
  • میں بالواسطہ یا بلاواسطہ امریکی باشندوں کے 10 فیصد سے زیادہ شیئرز/ ووٹنگ کا حق/ امریکی باشندوں کے انٹرسٹ کا مالک نہیں ہوں اور/یا دوسرے ذرائع سے امریکی شہریوں یا رہائشیوں کو کنٹرول نہیں کرتا ہوں۔
  • میں بالواسطہ یا بلاواسطہ امریکی باشندوں کے 10 فیصد سے زیادہ شیئرز/ ووٹنگ کا حق/ انٹرسٹ کا مالک نہیں ہوں اور/ یا کسی دوسرے ذریعے سے امریکی شہری یا رہائشی کے کنٹرول میں نہیں ہوں۔
  • میں FATCA کے سیکشن (a)1504 کے معاملے میں امریکی شہریوں یا رہائشیوں کے ساتھ وابستہ نہیں ہوں
  • میں غلط اعلان کرنے پر اپنی ذمہ داری سے واقف ہوں۔
اس بیان کے مقاصد کے لئے، ریاستہائے متحدہ امریکہ کے تمام منحصر ممالک اور علاقوں کو امریکہ کے مرکزی علاقے کے برابر کردیا گیا ہے۔ میں اپنے اس بیان کی خلاف ورزی سے پیدا ہونے یا اس سے متعلق ہونے والے کسی بھی دعوے کے خلاف، بے ضرر آکٹا مارکیٹس انکارپوریٹڈ، اس کے ڈائریکٹرز اور افسران کا دفاع کرنے کا عہد کرتا ہوں۔
ہم آپ کی رازداری اور آپ کی ذاتی معلومات کے تحفظ کے لیے وقف ہیں۔ ہم محض اپنی پراڈکٹس اور سروسز کے متعلق خصوصی پیشکشوں اور اہم معلومات فراہم کرنے کے لیے ای میلز اکٹھا کرتے ہیں۔ اپنا ای میل ایڈریس دے کر، آپ ہم سے ایسے ای میلز وصول کرنے پر اتفاق کرتے ہیں۔ اگر آپ انسبسکرائب کرنا چاہتے ہیں یا کوئی سوالات یا خدشات ہوں تو، ہماری کسٹمر سپورٹ کو لکھیں۔
Test
Back

USD/ZAR Price Analysis: Marks another bounce off 100-day EMA

  • USD/ZAR keeps Friday’s recovery moves from 17.09 to stay above the key EMA.
  • A two-month-old falling trend line restricts further recovery.
  • 61.8% Fibonacci retracement, the monthly low can lure the bears.

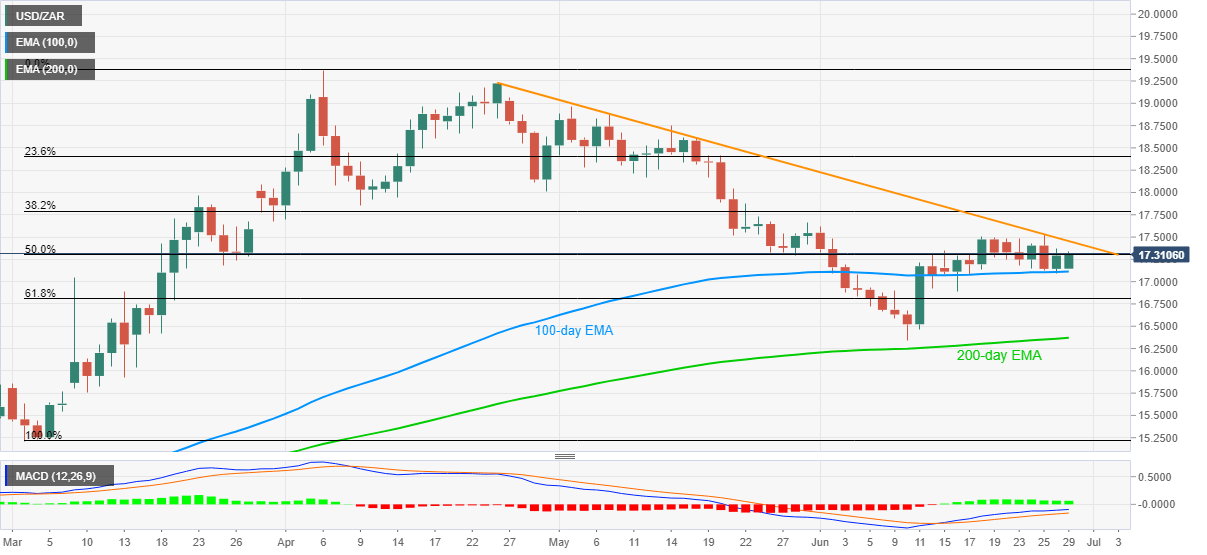
USD/ZAR takes the bids near 17.33 during the initial hour of Tokyo open on Monday. The pair remains above 100-day EMA since the early days of the month amid bullish MACD signals. Even so, a falling trend line from April 24 seems to challenge the bulls at present.

In a case where the bulls cheer MACD signals and cross the 17.45 resistance line on a daily closing, May 29 high surrounding 17.66 and April 30 low near 18.00 could be on their radars. However, multiple resistances between 18.00 and 18.20 could challenge the pair’s further upside.

If at all the bulls dominate past-18.20, 19.00, 19.22 and April month’s top near 19.38 might offer intermediate halts during the rise to 20.00 threshold.

Alternatively, the pair’s declines below 100-day EMA level of 17.11 could drag it to 61.8% Fibonacci retracement of March-April upside near 16.80.

Though, a 200-day EMA level of 16.37 and the monthly low near 16.33 could question the pair bears below 16.80.

USD/ZAR daily chart
Trend: Bullish


New Zealand finmin Robertson supports RBNZ's decision to use alternative tools

New Zealand Financial Minister Grant Robertson has crossed the worse saying that the coordination of fiscal, monetary policy is crucial. Robertson has
مزید پڑھیں Previous

EUR/USD Price Analysis: Signs of indecision near 1.12

EUR/USD defended the psychological support of 1.12 for the second consecutive day on Friday and is currently trading around 1.1220. The pair formed a
مزید پڑھیں Next