NZD/USD Price Analysis: Mildly offered beyond 0.6500
- NZD/USD seesaws near the intraday low of 0.6538.
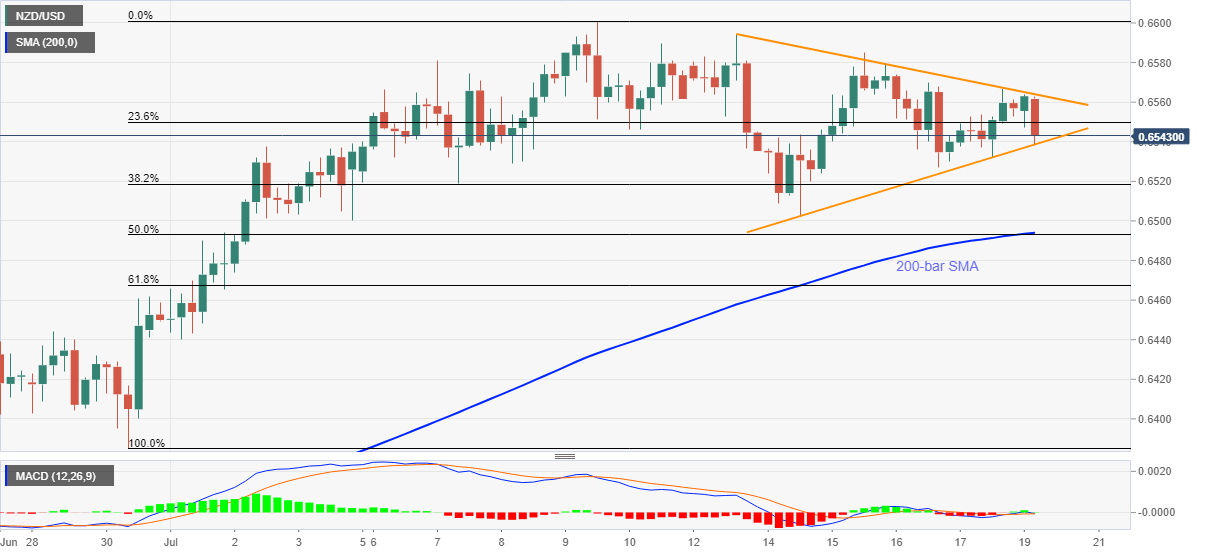
- Weekly symmetrical triangle restricts immediate moves.
- A confluence of 200-bar SMA, 50% Fibonacci retracement offers strong support.
- Bulls will need successful trading above 0.6600 to justify the momentum strength.
NZD/USD defies Friday’s recovery moves while declining to 0.6543, down 0.21% on a day, amid Monday’s Asian session. The kiwi pair recently took a U-turn from the short-term triangle’s resistance line. However, the formation’s support restricts the quote’s further downside.
Hence, traders are waiting for a clear move either beyond the pattern’s resistance of 0.6565 or below the nearby support line close to 0.6535 for fresh entries.
In doing so, market players will also consider the monthly top surrounding 0.6600 as the key barrier to the run-up towards the mid-January peak near 0.6665.
On the contrary, 200-bar SMA and 50% Fibonacci retracement of June 30 to July 09 upside, around 0.6500-0.6495, becomes the tough nut to crack for the bears, past-0.6535, to recall June 29 high around 0.6445.
NZD/USD four-hour chart
Trend: SIdeways