AUD/USD Price Analysis: Loss of 0.71 may prove crucial, further falls eyed– Confluence Detector
AUD/USD has been on the back foot as the market mood has worsened amid intensifying Sino-American tensions. China closed the US consulate in Chengdu in retaliation for Washington's move against China's mission in Houston, the latter accused of spying.
The safe-haven dollar is gaining ground and the Aussie, a risk currency, is losing ground. Investors are also concerned about the coronavirus situation in Melbourne and are shrugging off upbeat Australian Purchasing Managers' Indexes.
How is A$/USD positioned on the technical charts? Bulls may be on the back foot after the recent decline.
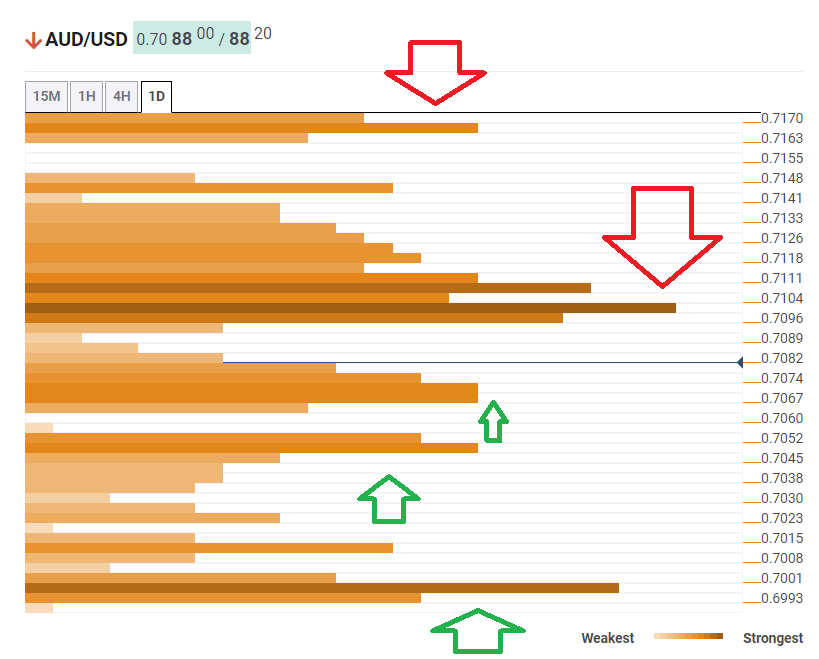
The Technical Confluences Indicator is showing that AUD/USD faces fierce resistance at the 0.7096 to 0.7104 region, which is a dense cluster of lines including the Pivot Point one-month Resistance 1, the Simple Moving Average 5-4h, the Bollinger Band 15min-Middle, and more.
If the currency pair manages to overcome that hurdle, it would eye 0.7170, which is the convergence of the PP one-week R3 and the previous daily high.
Looking down, immediate support is at 0.7067, where the previous monthly high, the BB 15min-Lower, and the PP one-day S1 meet up.
The next soft support is at 0.7045, which is where the PP one-week R1 hits the price.
Strong support awaits only at 0.7001, which is the confluence of the PP one-day S3, the SMA 100-4h, and the Fibonacci 38.2% one-week.
Here is how it looks on the tool:
Confluence Detector
The Confluence Detector finds exciting opportunities using Technical Confluences. The TC is a tool to locate and point out those price levels where there is a congestion of indicators, moving averages, Fibonacci levels, Pivot Points, etc.
Learn more about Technical Confluence