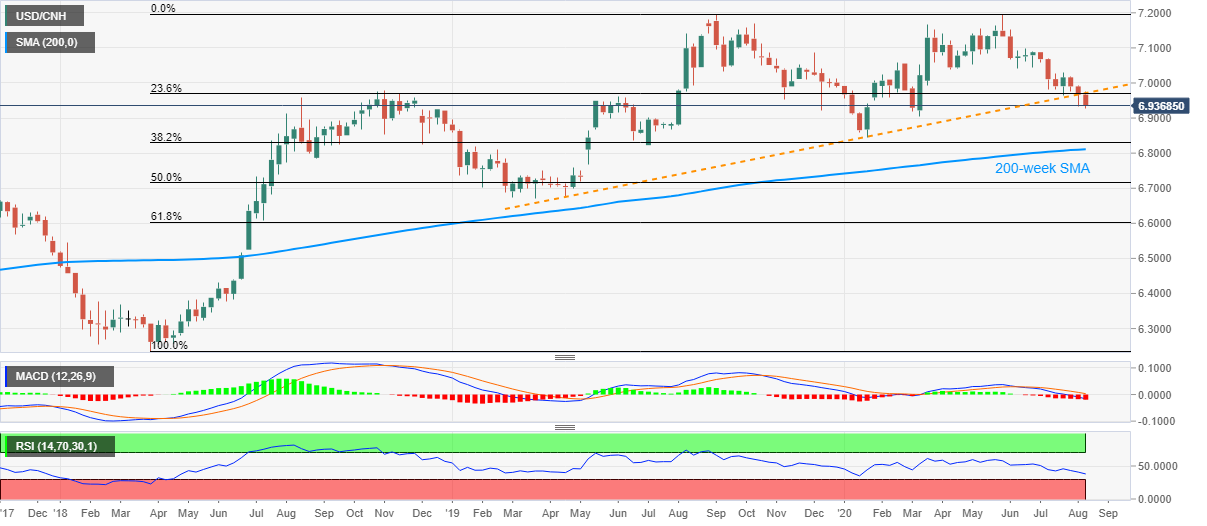
USD/CNH Price Analysis: Weekly chart suggests further downside
- USD/CNH keeps the break of 16-month-old trend line despite bouncing off 6.9276.
- Bearish MACD, lack of oversold RSI indicates room for additional declines.
- 6.9700 resistance confluence restricts the pair’s immediate upside.
USD/CNH picks up the bids near 6.9355/60 during the early Thursday. The pair refreshed five-month low the previous day. In doing so, it extends the downside break of an ascending trend line from April 2019.
Other than the sustained downside below the key support line, now resistance, bearish MACD and an absence of oversold RSI conditions also favor the sellers.
As a result, March month’s low near 6.9050 acts as immediate support for the pair sellers to watch ahead of 6.9000 round-figures. In a case where the bears dominate past-6.9000, the yearly bottom surrounding 6.8455 will be challenged.
Alternatively, the support-turned-resistance line joins 23.6% Fibonacci retracement of the pair’s upside between March 2018 and September 2019 to confine the immediate upside near 6.9700.
Additionally, 7.000 psychological magnet and late-July top near 7.0300 could lure the bulls past-6.9700.
USD/CNH weekly chart

Trend: Bearish
