WTI Price Analysis: Bears seen tiring near key support zone below 100-day EMA
- WTI struggles for a clear direction between $39.15 and $39.65 immediate trading range.
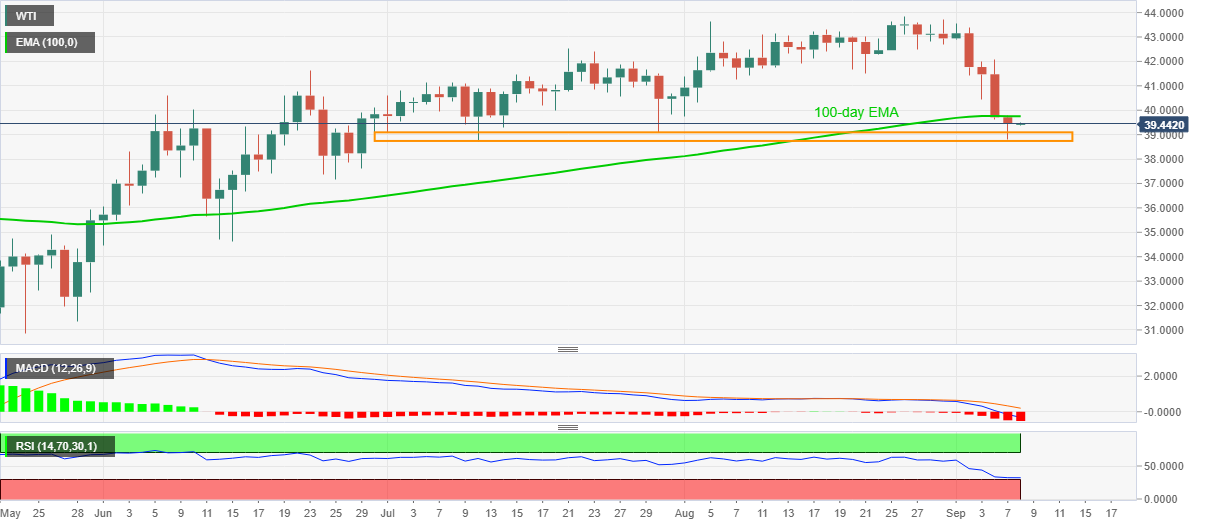
- Oversold RSI, multiple bounces off the key support area favor the buyers.
- MACD stays most bearish since April, 100-day EMA guards immediate upside.
WTI trades near $39.45 during the early Tuesday’s Asian session. In doing so, the energy benchmark seesaws near the two-month low flashed the previous day. While MACD flashes the most bearish signals since April and the 100-day EMA restricts the quote’s immediate upside, an area including lows marked since June 30 offers strong support to the quote amid oversold RSI.
As a result, the black gold’s attempt to confront the key EMA, at 39.75 now, can’t be ruled out. However, bulls will wait for a daily closing beyond $40.00 before attacking the August 21 low near $41.50.
It should also be noted that the commodity’s sustained rise past-$41.50 enables it to probe August 26 top near $43.86 in search of February month’s low near $44.00.
Alternatively, sellers may struggle unless the quote breaks down the region between $39.10 and $38.70.
Though, a clear decline below $38.70 might not hesitate to challenge June 25 low near $37.15.
WTI daily chart
Trend: Pullback expected