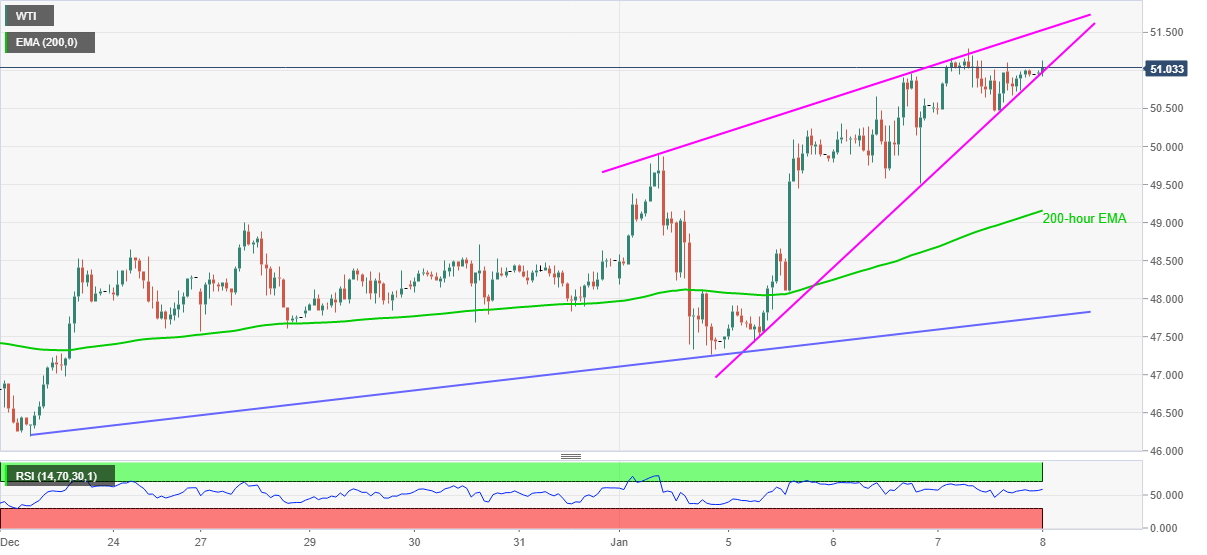
WTI Price Analysis: Flirts with $51.00 inside immediate rising wedge
- WTI bulls struggle to keep the reins inside short-term bearish chart formation.
- Sellers can target 200-hour EMA during fresh declines, oil bulls keep February 2020 top on radar.
WTI wavers around $51.00, currently up 0.10 intraday, during Friday’s Asian session. In doing so, the oil benchmark stays near the highest levels in 11 months while also portraying a bearish chart pattern on the hourly (1h) play.
Given the normal RSI conditions and a lack of immediate upside barrier, WTI is likely to stay positive for a while inside the stated chart formation.
However, any downside break of $50.95 will not hesitate to recall the sellers targeting the 200-hour EMA level of $49.15. During the fall, the $50.00 psychological magnet will be important.
Should the oil bears dominate past-$49.15, an ascending trend line from December 23, at $47.75 now, will be in the spotlight.
Meanwhile, the recently flashed multi-day high of $51.30 can offer immediate resistance to the quote ahead of directing it to the stated pattern’s upper line near $51.55.
If at all the WTI bulls defy the bearish chart pattern by clearing $51.55, February 2020 top near $54.70 will be their favorite.
WTI hourly chart

Trend: Pullback expected
