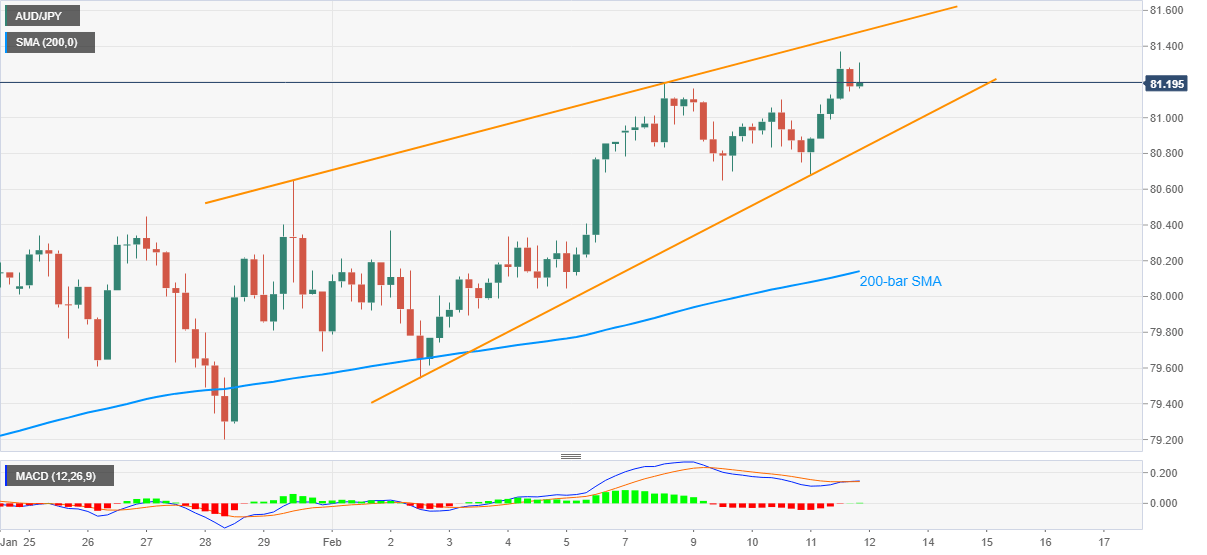
AUD/JPY Price Analysis: Braces for further rise above 81.00 inside monthly rising wedge
- AUD/JPY stays firmer around the highest since December 2018.
- MACD flirts with the bulls inside a bearish chart pattern.
- 200-bar SMA adds to the support, wedge’s resistance probes buyers.
AUD/JPY refreshes intraday high to 81.31, currently around 81.23, during the initial Asian session on Friday. The pair rose to the highest since late 2018 the previous day as the MACD turns bullish after nearly a week-long bearish drive.
Even so, the quote portrays a bearish chart pattern, rising wedge, on the four-hour (4H) formation.
Hence, further upside beyond the latest multi-month high of 81.37 can’t be ruled out but the stated pattern’s resistance line, near 81.50 now, can challenge the AUD/JPY bulls afterward.
In a case where AUD/JPY remains positive past-81.50, the mid-December 2018 top close to 82.20 should gain the market’s attention.
Meanwhile, a downside break of the 80.80 level will confirm the bearish chart pattern that signals the AUD/JPY fall towards marking the fresh bottom of the year below January’s trough near 79.20.
However, 200-bar SMA and the monthly low, respectively around 80.15 and 79.55, can offer filters do the south-run.
AUD/JPY four-hour chart
Trend: Further upside expected