Confirming you are not from the U.S. or the Philippines

یہ بیان دے کر، میں واضح طور پر یہ بتاتا اور تصدیق کرتا ہوں کہ:
  • میں امریکی شہری یا رہائشی نہیں ہوں
  • میں فلپائن کا رہائشی نہیں ہوں
  • میں بالواسطہ یا بلاواسطہ امریکی باشندوں کے 10 فیصد سے زیادہ شیئرز/ ووٹنگ کا حق/ امریکی باشندوں کے انٹرسٹ کا مالک نہیں ہوں اور/یا دوسرے ذرائع سے امریکی شہریوں یا رہائشیوں کو کنٹرول نہیں کرتا ہوں۔
  • میں بالواسطہ یا بلاواسطہ امریکی باشندوں کے 10 فیصد سے زیادہ شیئرز/ ووٹنگ کا حق/ انٹرسٹ کا مالک نہیں ہوں اور/ یا کسی دوسرے ذریعے سے امریکی شہری یا رہائشی کے کنٹرول میں نہیں ہوں۔
  • میں FATCA کے سیکشن (a)1504 کے معاملے میں امریکی شہریوں یا رہائشیوں کے ساتھ وابستہ نہیں ہوں
  • میں غلط اعلان کرنے پر اپنی ذمہ داری سے واقف ہوں۔
اس بیان کے مقاصد کے لئے، ریاستہائے متحدہ امریکہ کے تمام منحصر ممالک اور علاقوں کو امریکہ کے مرکزی علاقے کے برابر کردیا گیا ہے۔ میں اپنے اس بیان کی خلاف ورزی سے پیدا ہونے یا اس سے متعلق ہونے والے کسی بھی دعوے کے خلاف، بے ضرر آکٹا مارکیٹس انکارپوریٹڈ، اس کے ڈائریکٹرز اور افسران کا دفاع کرنے کا عہد کرتا ہوں۔
ہم آپ کی رازداری اور آپ کی ذاتی معلومات کے تحفظ کے لیے وقف ہیں۔ ہم محض اپنی پراڈکٹس اور سروسز کے متعلق خصوصی پیشکشوں اور اہم معلومات فراہم کرنے کے لیے ای میلز اکٹھا کرتے ہیں۔ اپنا ای میل ایڈریس دے کر، آپ ہم سے ایسے ای میلز وصول کرنے پر اتفاق کرتے ہیں۔ اگر آپ انسبسکرائب کرنا چاہتے ہیں یا کوئی سوالات یا خدشات ہوں تو، ہماری کسٹمر سپورٹ کو لکھیں۔
Octa trading broker
ٹریڈنگ اکاؤنٹ کھولیں
Back

EUR/USD Price Analysis: Trapped below houly resistance, but firm above weekly support

  • EUR/USD on the verge of an upside extension from weekly support. 
  • The US dollar is treading on thin ice, DXY vulnerable to a break below daily 38.2% Fibo. 

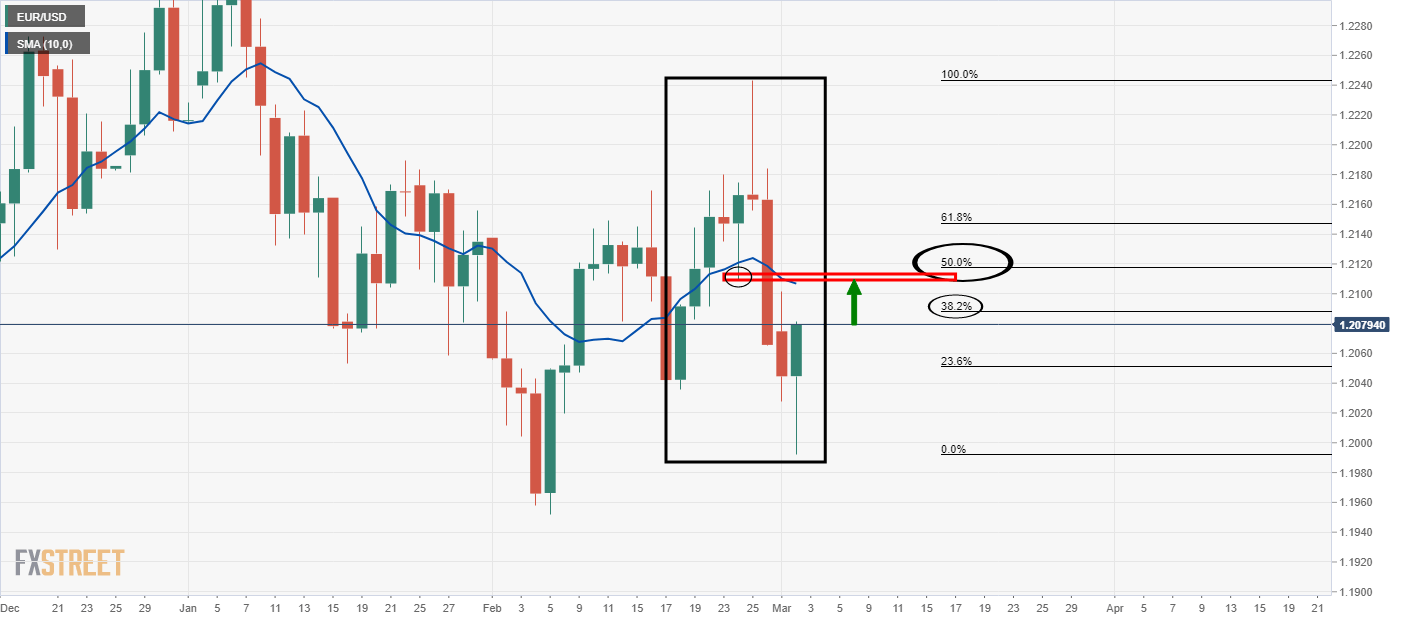
As per the prior analysis, EUR/USD Price Analysis: Bulls on track for test of 1.2110 while above1.2050's, the price has indeed moved in on the target and reached a high of 1.2113 before falling back on support in the 1.2050 area. 

Prior analysis 

The M-formation is a bullish pattern where the price would be expected to revert back to test the neckline and prior support, or, to at least the 38.2% Fibonacci level. 

Daily chart

Live market

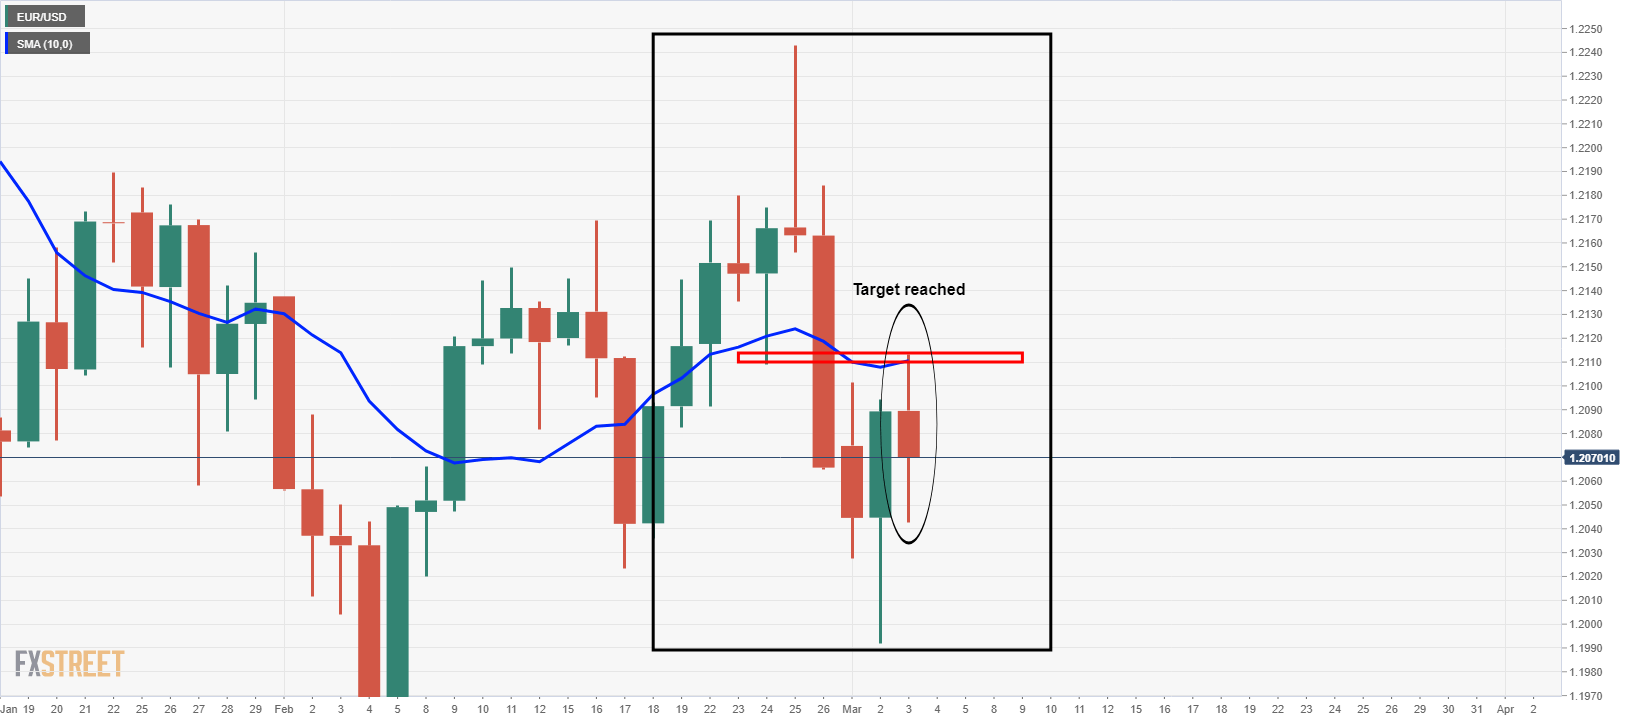
As illustrated, the price reached the target, but is now trapped between hourly support and resistance as follows:

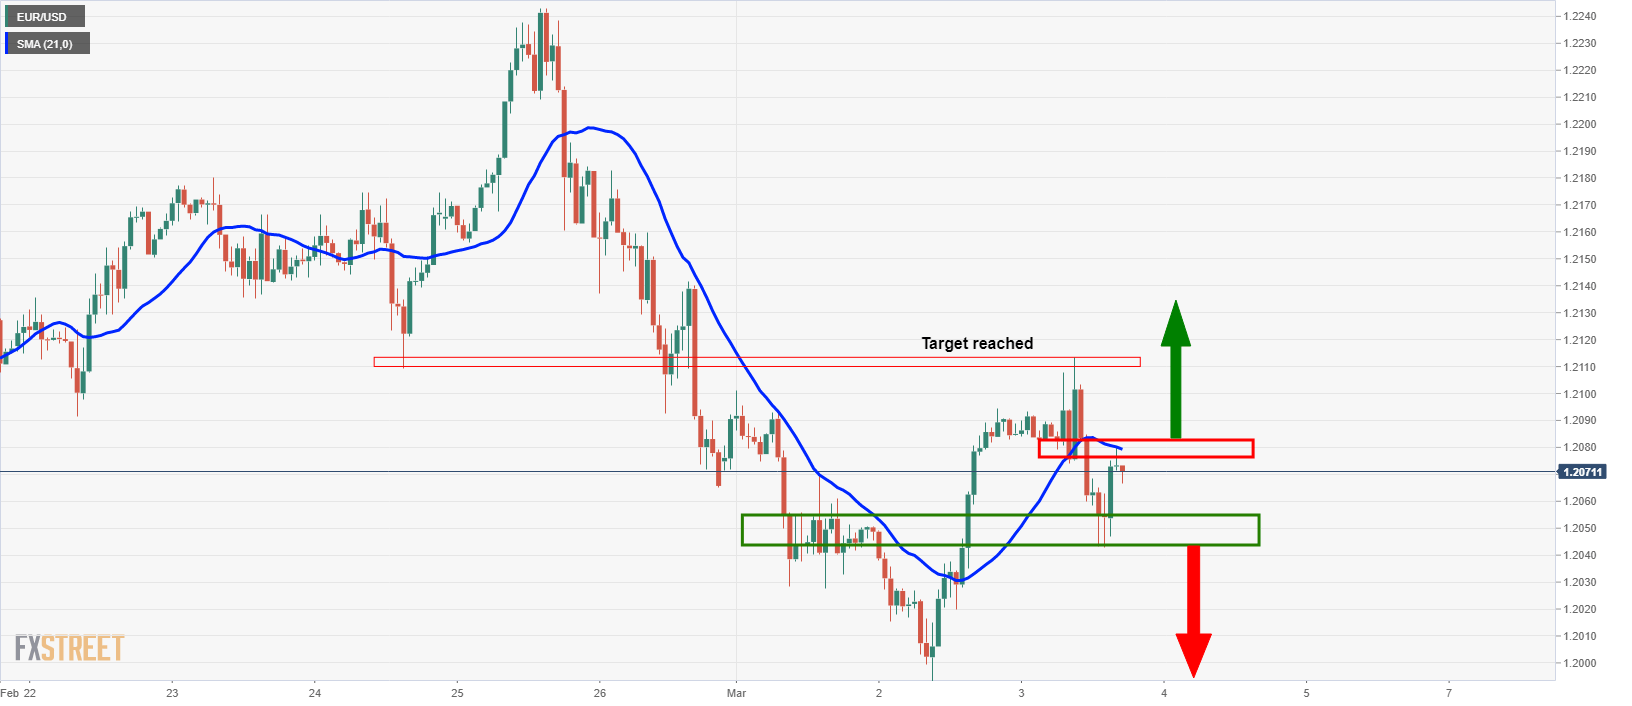
The price is trading below the 21-hour SMA which has a confluence with prior lows that are now acting as resistance.

There are prospects of a downside continuation on a break below 1.2040.

Meanwhile, the DXY is a mixed technical picture from a daily perspective:

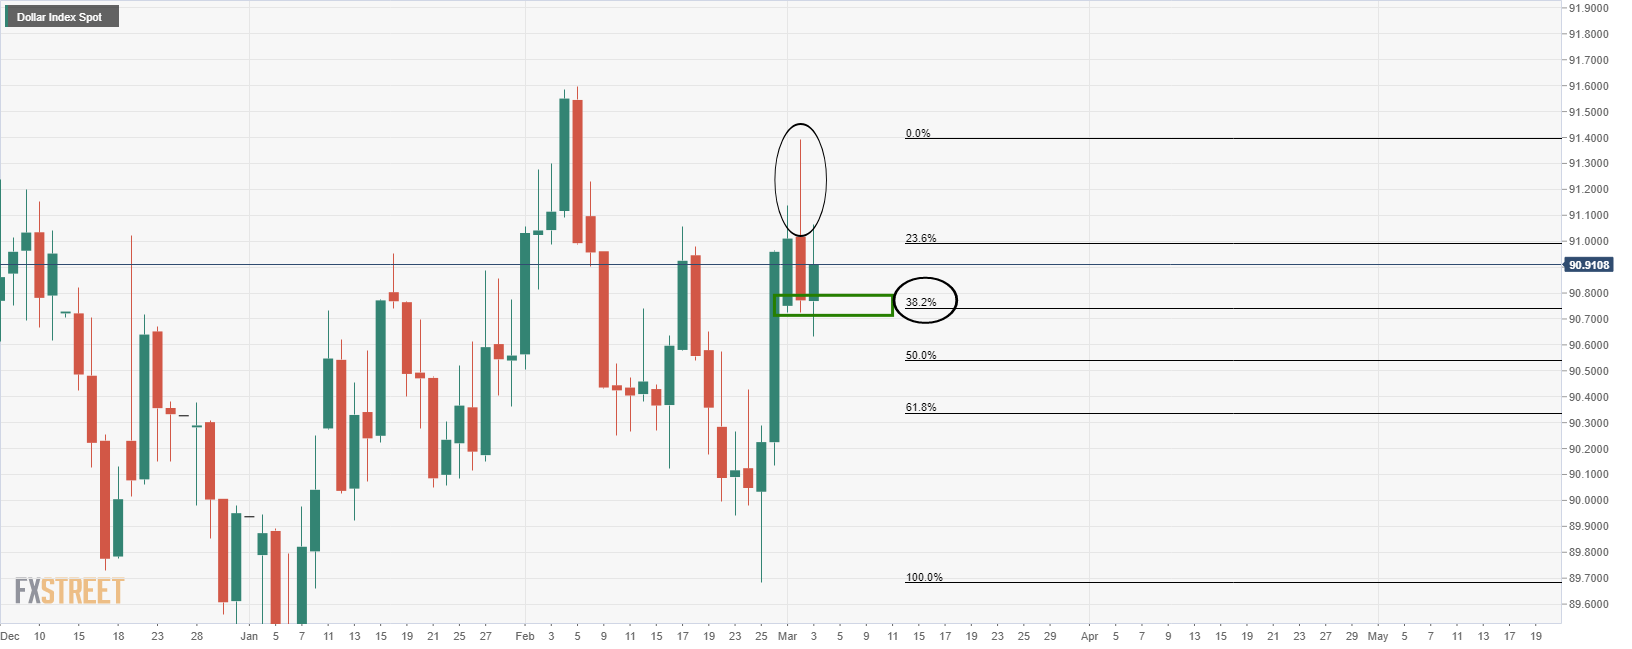
There has been a huge rejection which has left a bearish wick while, at the same time, the price has corrected to a 38.2% Fibonacci retracement level in a discount for the bulls. 

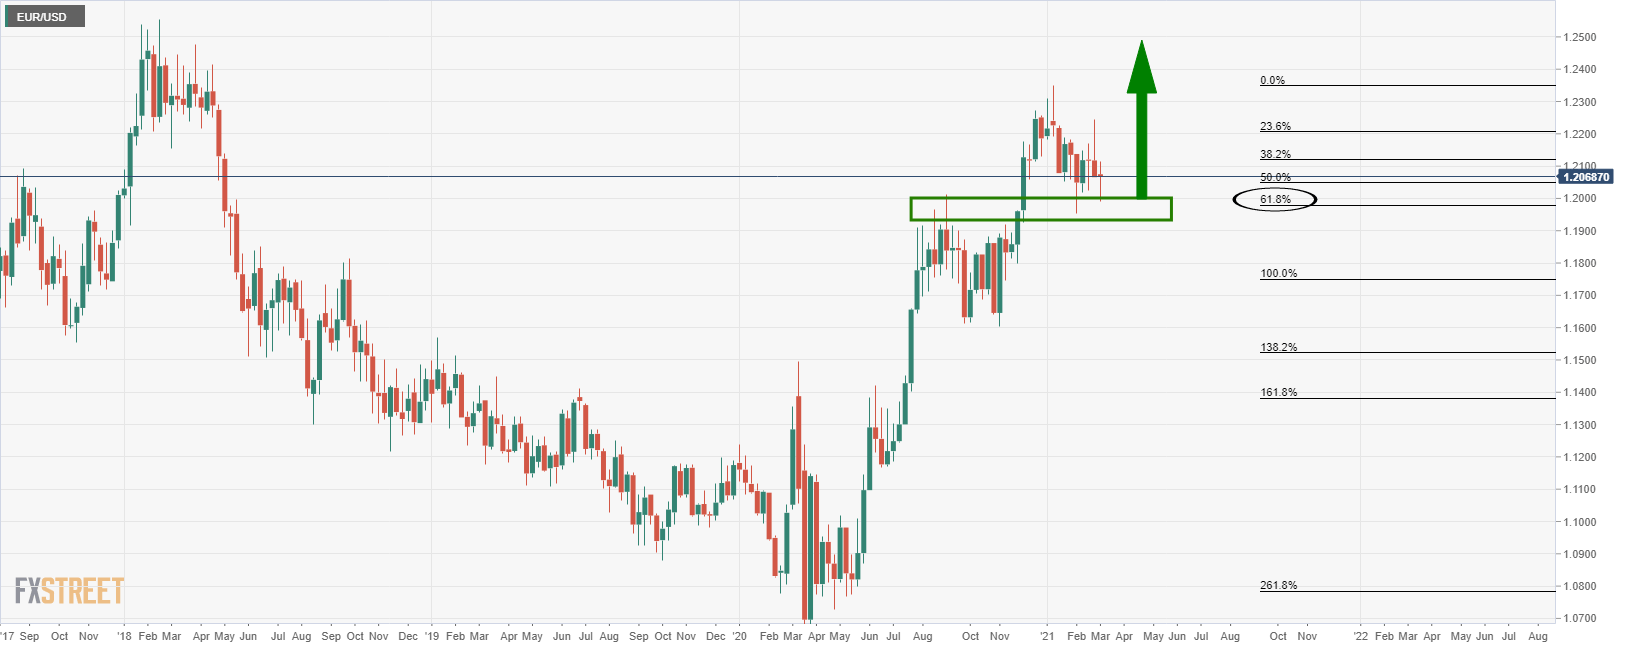
From a weekly perspective, the euro is in a corrective phase, so an upside correction is very possible.

 Therefore, the current support in the DXY is fragile. 

EUR/USD, weekly chart

NZD/USD back at the 0.7250 mark as strong dollar, downbeat risk appetite weigh on the kiwi

NZD/USD is consolidating around the 0.7250 mark having slipped back from earlier Asia Pacific and European session highs in the 0.7300 region amid a m
مزید پڑھیں Previous

USD/CAD drops toward 1.2600 as CAD capitalizes on surging oil prices

The USD/CAD pair advanced to a daily high of 1.2659 in the early American session but lost its traction with rising crude oil prices providing a boost
مزید پڑھیں Next