US Dollar Index climbs to fresh 2-month tops around 92.00
- DXY pushes higher and advances to the 92.00 area.
- The dollar remains well bid following the FOMC event.
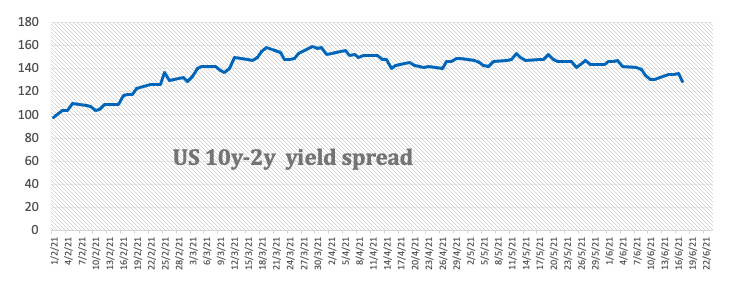
- US 10-year yields appear side-lined around 1.50%.
The greenback accelerates the upside and lifts the US Dollar Index (DXY) to fresh 2-month peaks beyond the 92.00 yardstick.
US Dollar Index stronger post-FOMC
The index advances on a firm footing and posts gains for the fourth consecutive session at the end of the week, extending at the same time the recent breakout of the critical 200-day SMA, today at 91.51.
The change of heart around the dollar came after the Fed signalled intentions to hike rates at some point in late 2023 and that the tapering of the QE programme has been brought forward.
The strong rebound in DXY came in stark contrast to the steady performance of US yields, with the 10-year benchmark extending the consolidative mood around the 1.50% zone so far.
Nothing scheduled data wise in the US calendar, exposing the dollar’s price action to the broad risk appetite trends.
What to look for around USD
The index moved just beyond the 92.00 level as investors continue to adjust to the recent hawkish message from the FOMC at its meeting on Wednesday. The likeliness that the tapering talk could kick in before anyone has anticipated and the view of higher rates in 2023 fuel the sharp bounce in the buck to levels last seen in mid-April. However, the still unchanged view on “transient” higher inflation and hence the continuation of the dovish stance by the Federal Reserve carries the potential to temper the current momentum in the dollar. A sustained break above the critical 200-day SMA should shift the dollar’s outlook to a more constructive one.
Eminent issues on the back boiler: Biden’s plans to support infrastructure and families, worth nearly $6 trillion. US-China trade conflict under the Biden’s administration. Tapering speculation vs. economic recovery. US real interest rates vs. Europe. Could US fiscal stimulus lead to overheating?
US Dollar Index relevant levels
Now, the index is gaining 0.06% at 91.94 and a breakout of 92.07 (monthly high Jun.18) would open the door to 92.46 (23.6% Fibo level of the 2020-2021 drop) and finally 93.43 (2021 high Mar.21). On the flip side, the next contention aligns at 89.53 (monthly low May 25) followed by 89.20 (2021 low Jan.6) and then 88.94 (monthly low March 2018).