Gold Price Forecast: XAU/USD has room to fall towards $1766 – Confluence Detector
- Gold’s rebound falters amid strengthening US dollar, yields.
- Risk-sentiment sours, markets reassess the Fed’s tightening calls.
- Gold Weekly Forecast: XAU/USD poised to extend slide after breaking key supports
Gold price is heading back towards the two-month lows of $1861 amid a turnaround in the risk sentiment. Gold turns south amid a pick up in the US dollar recovery, underpinned by worsening market mood. A renewed uptick in the US Treasury yields also weighs on the non-yielding gold, as markets reprice the Fed’s tightening expectations amid resurfacing inflation debate and last week’s hawkish shift. Fed Chair Jerome Powell reiterated, in his prepared remarks, that the inflationary pressures should deflate towards its goal while dismissing them as temporary.
Investors eagerly await Powell’s hearing on Tuesday for the Q&A session that may shed more light on his view on the economic and monetary policy outlooks, which will have a significant impact on gold price.
Read: Markets search for direction ahead of Powell testimony
Gold Price: Key levels to watch
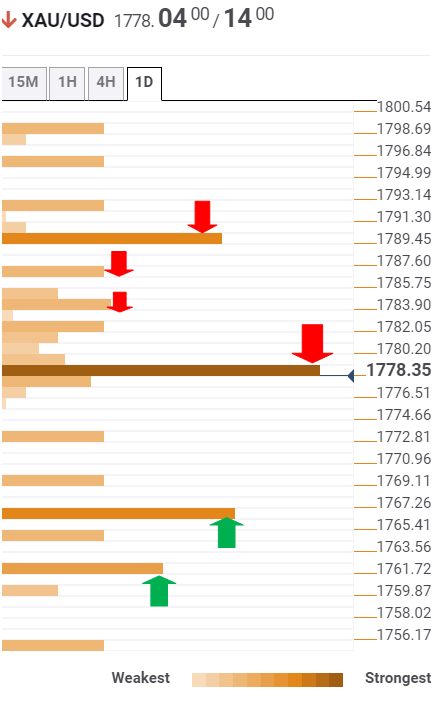
The Technical Confluences Detector shows that gold price has breached key support at $1779, where the Fibonacci 38.2% one-day and Bollinger Band one-day Lower collided.
Therefore, the downside has opened up towards the previous month’s low of $1766.
Further weakness could knock off the gold price to the previous week’s low of $1761.
Alternatively, recapturing the abovementioned powerful resistance at $1779 could reinforce bullish interest, calling for a test of the Fibonacci 23.6% one-day at $1782.
The previous day’s high at $1786 will be on the buyers’ radars, as they look to take out the $1790 hurdle.
That level is the intersection of the previous high four-hour and the Fibonacci 23.6% one-week.
Here is how it looks on the tool
About Technical Confluences Detector
The TCD (Technical Confluences Detector) is a tool to locate and point out those price levels where there is a congestion of indicators, moving averages, Fibonacci levels, Pivot Points, etc. If you are a short-term trader, you will find entry points for counter-trend strategies and hunt a few points at a time. If you are a medium-to-long-term trader, this tool will allow you to know in advance the price levels where a medium-to-long-term trend may stop and rest, where to unwind positions, or where to increase your position size.