USD/CAD Price Analysis: Drops back below 1.2600, HMA confluence in focus
- USD/CAD consolidates the previous day’s gains around intraday low.
- Downward sloping RSI line suggests further weakness towards 50, 100-HMA convergence.
- Weekly rising trend line, descending resistance line from July 19 add to the upside filters.
- One-week-old horizontal support becomes a tough nut to crack for bears.
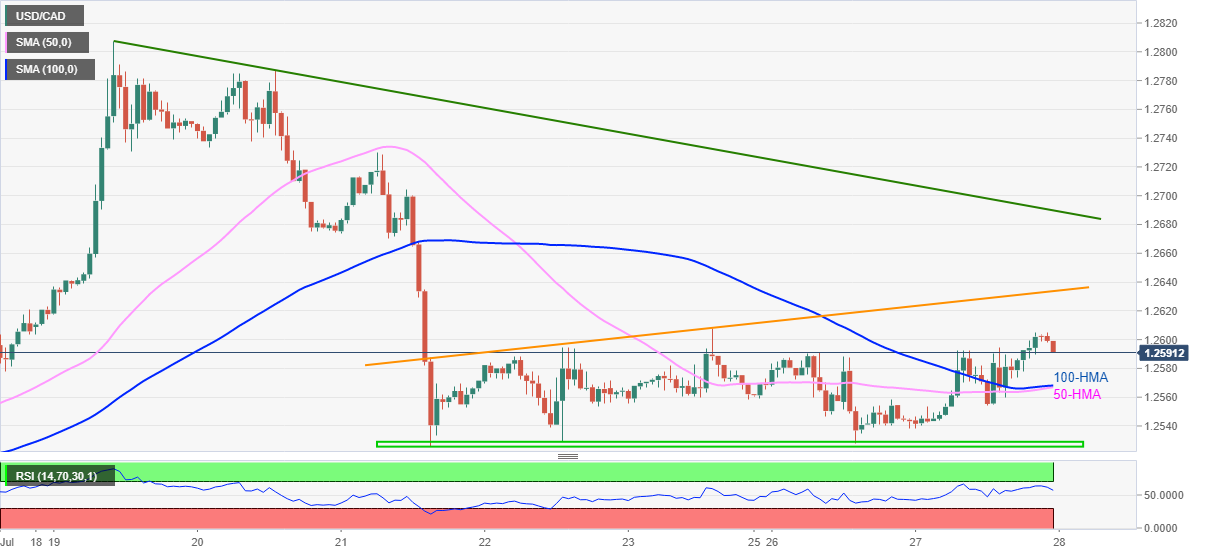
USD/CAD extends pullback from 1.2604 to refresh intraday low near 1.2590, down 0.08% on a day, amid Wednesday’s Asian session. The loonie pair rose the most in a week the previous day before taking a U-turn from 1.2604.
Failures to stay beyond the 1.2600 threshold join a descending RSI line to direct the intraday sellers toward a joint of 100-HMA and 50-HMA near 1.2565.
However, a horizontal region comprising multiple lows marked since July 21 restricts the quote’s further weakness around 1.2530-25.
Should USD/CAD bears keep reins past 1.2525, June’s top surrounding 1.2485-90 will be in the spotlight.
Alternatively, an upward sloping resistance line from July 21, around 1.2635, acts as an extra short-term hurdle to the north of the 1.2600 round figure.
Even if the USD/CAD buyers manage to cross the 1.2635 resistance line, a seven-day-old descending trend line near 1.2685 offers an additional challenge for them.
USD/CAD: Hourly chart
Trend: Pullback expected