US Dollar Index Price Analysis: DXY fades bounce off 100-SMA
- DXY struggles to extend the previous day’s rebound, eases from intraday top.
- Sustained trading below previous support from mid-November, weekly descending trend line keep sellers hopeful.
- 100-SMA, firmer Momentum tests further downside towards five-week-old support line.
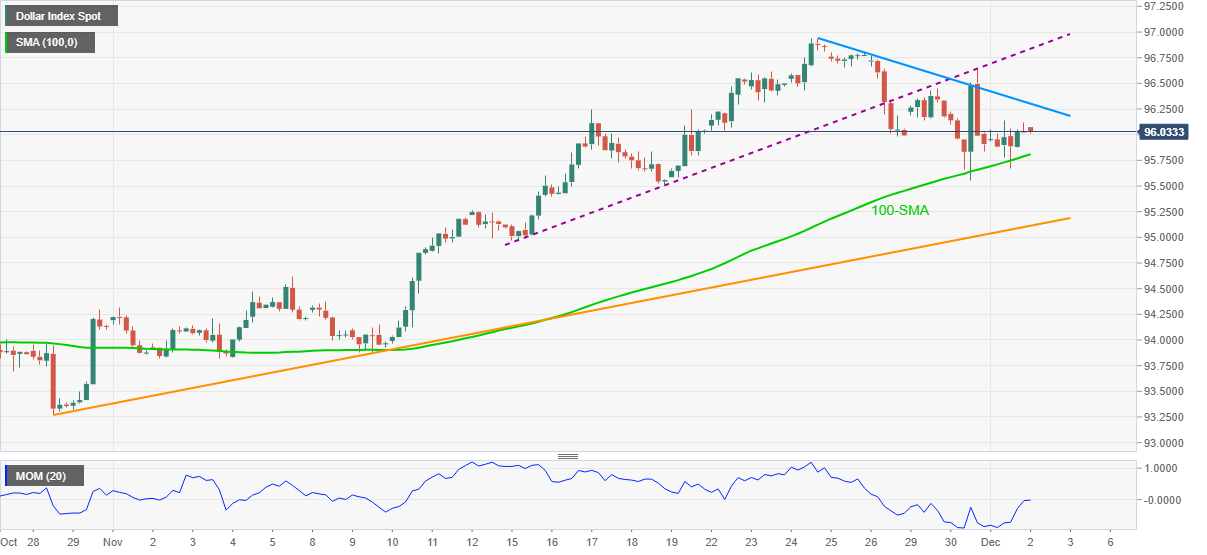
US Dollar Index (DXY) seesaws around 96.00, following the first daily positive in five, during early Thursday. The greenback gauge fails to stretch the previous day's bounce off 100-SMA.
Adding to the bearish bias is the DXY’s sustained trading below the weekly resistance line and the previous support from November 15.
However, a clear downside break of the 100-SMA level of 95.80 becomes necessary for the quote to recall the bears targeting an upward sloping trend line from late October near 95.20.
Meanwhile, a one-week-old falling trend line surrounding 96.30 guards immediate upside of the US Dollar Index, a break of which will direct bull to the support-turned-resistance line near 96.85.
It’s worth noting that the recently flashed multi-month high near 96.95 and the 97.00 threshold act as extra filters to the north.
DXY: Four-hour chart
Trend: Further weakness expected