NZD/USD grinds higher to 0.6630 on positive market mood
- The NZD/USD clings to the 0.6600 figure as volatility shrinks post-US NFP report.
- The rise in US Treasury yields stalls upward moves in the NZD/USD, as the 10-year yield sits above 1.90%.
- NZD/USD is downward biased and might test YTD lows if it fails to reclaim 0.6700.
The New Zealand dollar advances as the North American session begins holds above 0.6600 though it faces resistance at a 12 month-old bottom trendline of a descending channel. At the time of writing is trading at 0.6630. The market sentiment is tilted upbeat, though it is mixed in the FX complex.
Rising US Treasury yields across the curve weigh some in risk-sensitive currencies, led by the 10-year US T-bond benchmark note sitting at 1.931%, after a stellar US NFP report. However, the greenback failed to capitalize on that, as global central banks are looking towards tightening monetary conditions.
The Reserve Bank of New Zealand (RBNZ) would meet on February 26, where market analysts expect an increase of 25 bps to the overnight cash rate (OCR) to reach 1%. That would make it the first G8 central bank to reach that threshold, followed by the Bank of England (BoE), sitting at 0.50%.
Absence of New Zealand macroeconomic news, NZD/USD traders, would lean on the dynamics of the buck. Meanwhile, the US economic docket would not report tier one or two information until February 10, where the US Consumer Price Index (CPI) for January will be unveiled, foreseen to rise three tenths to 7.3%, followed by the Core CPI is estimated at 5.9%.
NZD/USD Price Forecast: Technical outlook
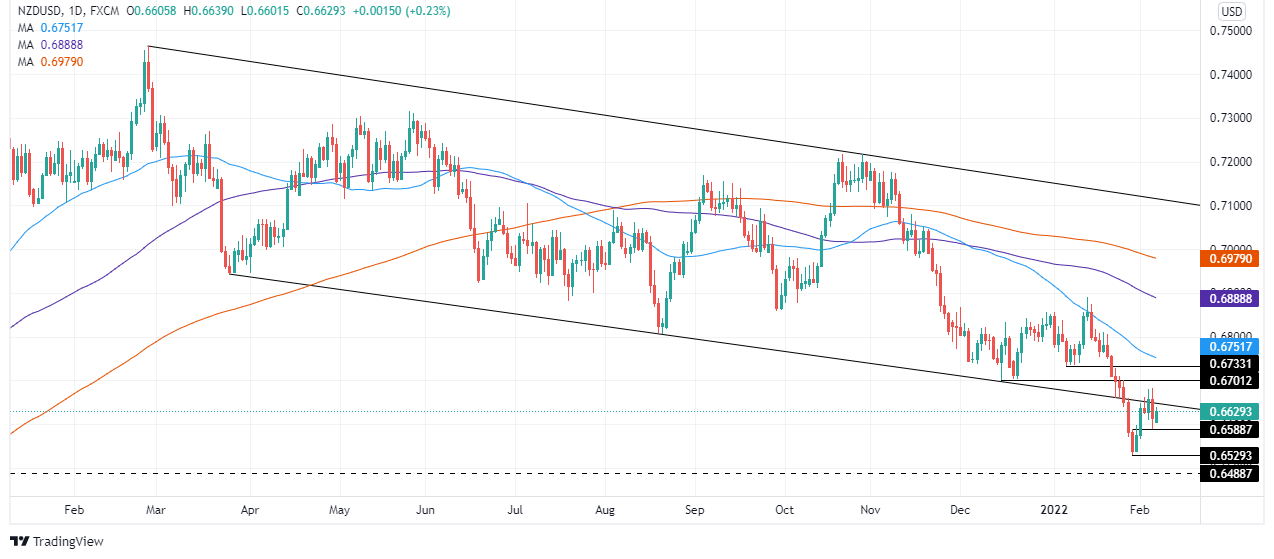
The NZD/USD remains downward biased. On Friday, a downslope bottom-trendline of a descending channel, rejected upward, moves around 0.6680, sending the pair tumbling towards the figure. Nevertheless, USD bulls could not push the pair to the 0.6500 handle, signaling that the pair might be headed in consolidation ahead of the RBNZ meeting late in the month.
Downwards, NZD/USD’s first support would be 0.6600. Breach of the latter would expose February 4 daily low at 0.6588, followed by January 28 cycle low at 0.6528 and then 0.6500.
On the opposite, the 0.6580-85 region, where the twelve-month-old downslope trendline pass, would be the first resistance, followed by January 6 daily low previous support-turned-resistance at 0.6732.