Confirming you are not from the U.S. or the Philippines

یہ بیان دے کر، میں واضح طور پر یہ بتاتا اور تصدیق کرتا ہوں کہ:
  • میں امریکی شہری یا رہائشی نہیں ہوں
  • میں فلپائن کا رہائشی نہیں ہوں
  • میں بالواسطہ یا بلاواسطہ امریکی باشندوں کے 10 فیصد سے زیادہ شیئرز/ ووٹنگ کا حق/ امریکی باشندوں کے انٹرسٹ کا مالک نہیں ہوں اور/یا دوسرے ذرائع سے امریکی شہریوں یا رہائشیوں کو کنٹرول نہیں کرتا ہوں۔
  • میں بالواسطہ یا بلاواسطہ امریکی باشندوں کے 10 فیصد سے زیادہ شیئرز/ ووٹنگ کا حق/ انٹرسٹ کا مالک نہیں ہوں اور/ یا کسی دوسرے ذریعے سے امریکی شہری یا رہائشی کے کنٹرول میں نہیں ہوں۔
  • میں FATCA کے سیکشن (a)1504 کے معاملے میں امریکی شہریوں یا رہائشیوں کے ساتھ وابستہ نہیں ہوں
  • میں غلط اعلان کرنے پر اپنی ذمہ داری سے واقف ہوں۔
اس بیان کے مقاصد کے لئے، ریاستہائے متحدہ امریکہ کے تمام منحصر ممالک اور علاقوں کو امریکہ کے مرکزی علاقے کے برابر کردیا گیا ہے۔ میں اپنے اس بیان کی خلاف ورزی سے پیدا ہونے یا اس سے متعلق ہونے والے کسی بھی دعوے کے خلاف، بے ضرر آکٹا مارکیٹس انکارپوریٹڈ، اس کے ڈائریکٹرز اور افسران کا دفاع کرنے کا عہد کرتا ہوں۔
ہم آپ کی رازداری اور آپ کی ذاتی معلومات کے تحفظ کے لیے وقف ہیں۔ ہم محض اپنی پراڈکٹس اور سروسز کے متعلق خصوصی پیشکشوں اور اہم معلومات فراہم کرنے کے لیے ای میلز اکٹھا کرتے ہیں۔ اپنا ای میل ایڈریس دے کر، آپ ہم سے ایسے ای میلز وصول کرنے پر اتفاق کرتے ہیں۔ اگر آپ انسبسکرائب کرنا چاہتے ہیں یا کوئی سوالات یا خدشات ہوں تو، ہماری کسٹمر سپورٹ کو لکھیں۔
Octa trading broker
ٹریڈنگ اکاؤنٹ کھولیں
Test
Back

USD/CAD Price Analysis: Extends bounce off 50-day EMA towards 1.2800

  • USD/CAD renews intraday high, keeps corrective pullback from 13-day low.
  • Bearish MACD signals, steady RSI favor sellers until staying below 1.2920.
  • Key Fibonacci retracement levels add to the downside filters

USD/CAD picks up bids to renew daily top surrounding 1.2800, after the biggest daily fall towards testing a fortnight low. In doing so, the Loonie pair rebounds from the 50-day EMA during Tuesday’s Asian session.

Even so, bearish MACD signals and the steady RSI keeps USD/CAD bulls worried. Also challenging the recovery moves is the 10-day EMA level surrounding 1.2845.

Additionally, a three-week-long horizontal area comprising the 23.6% Fibonacci retracement (Fibo.) of April-May upside, as well as the tops marked during early May, will also challenge the pair’s short-term upside near 1.2920.

In a case where USD/CAD rises past 1.2920, the 1.3000 threshold and the monthly peak of 1.3076 will be on the bull’s radar.

On the contrary, a daily closing below the 50-day EMA level of 1.2764 can direct USD/CAD sellers towards the 50% and 61.8% Fibonacci retracements, respectively near 1.2740 and 1.2660.

Following that, a south-run towards the late April swing low near 1.2460 can’t be ruled out.

USD/CAD: Daily chart
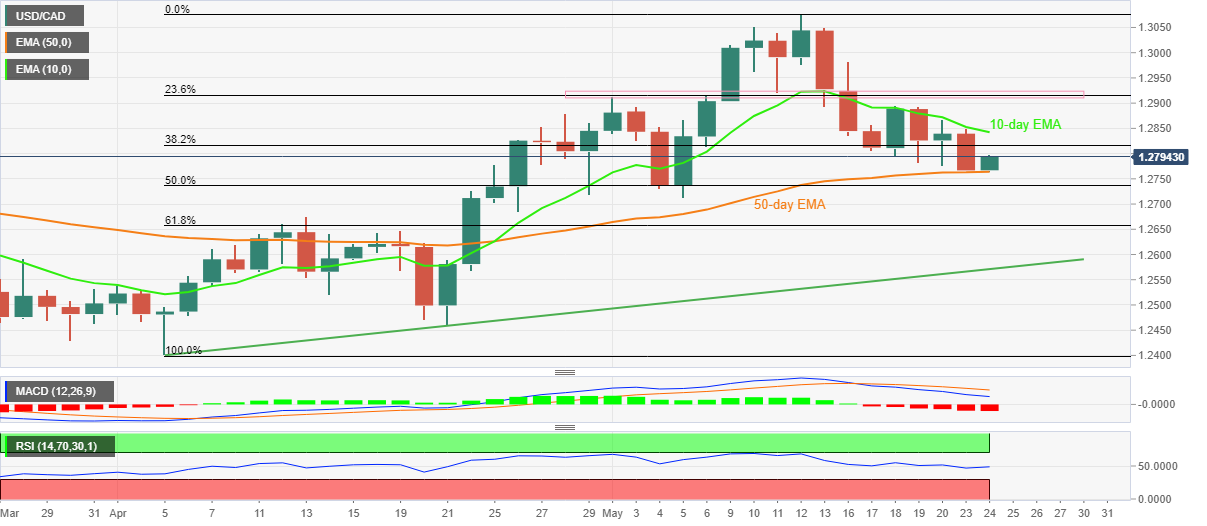
Trend: Further weakness expected


EUR/USD Price Analysis: Bulls are taking over through key daily resistance

The US dollar is under pressure and the euro has caught a bid on a combination of the market's pivot towards the European Central Bank and refreshed h
مزید پڑھیں Previous

Japan Jibun Bank Manufacturing PMI above forecasts (52) in May: Actual (53.2)

Japan Jibun Bank Manufacturing PMI above forecasts (52) in May: Actual (53.2)
مزید پڑھیں Next