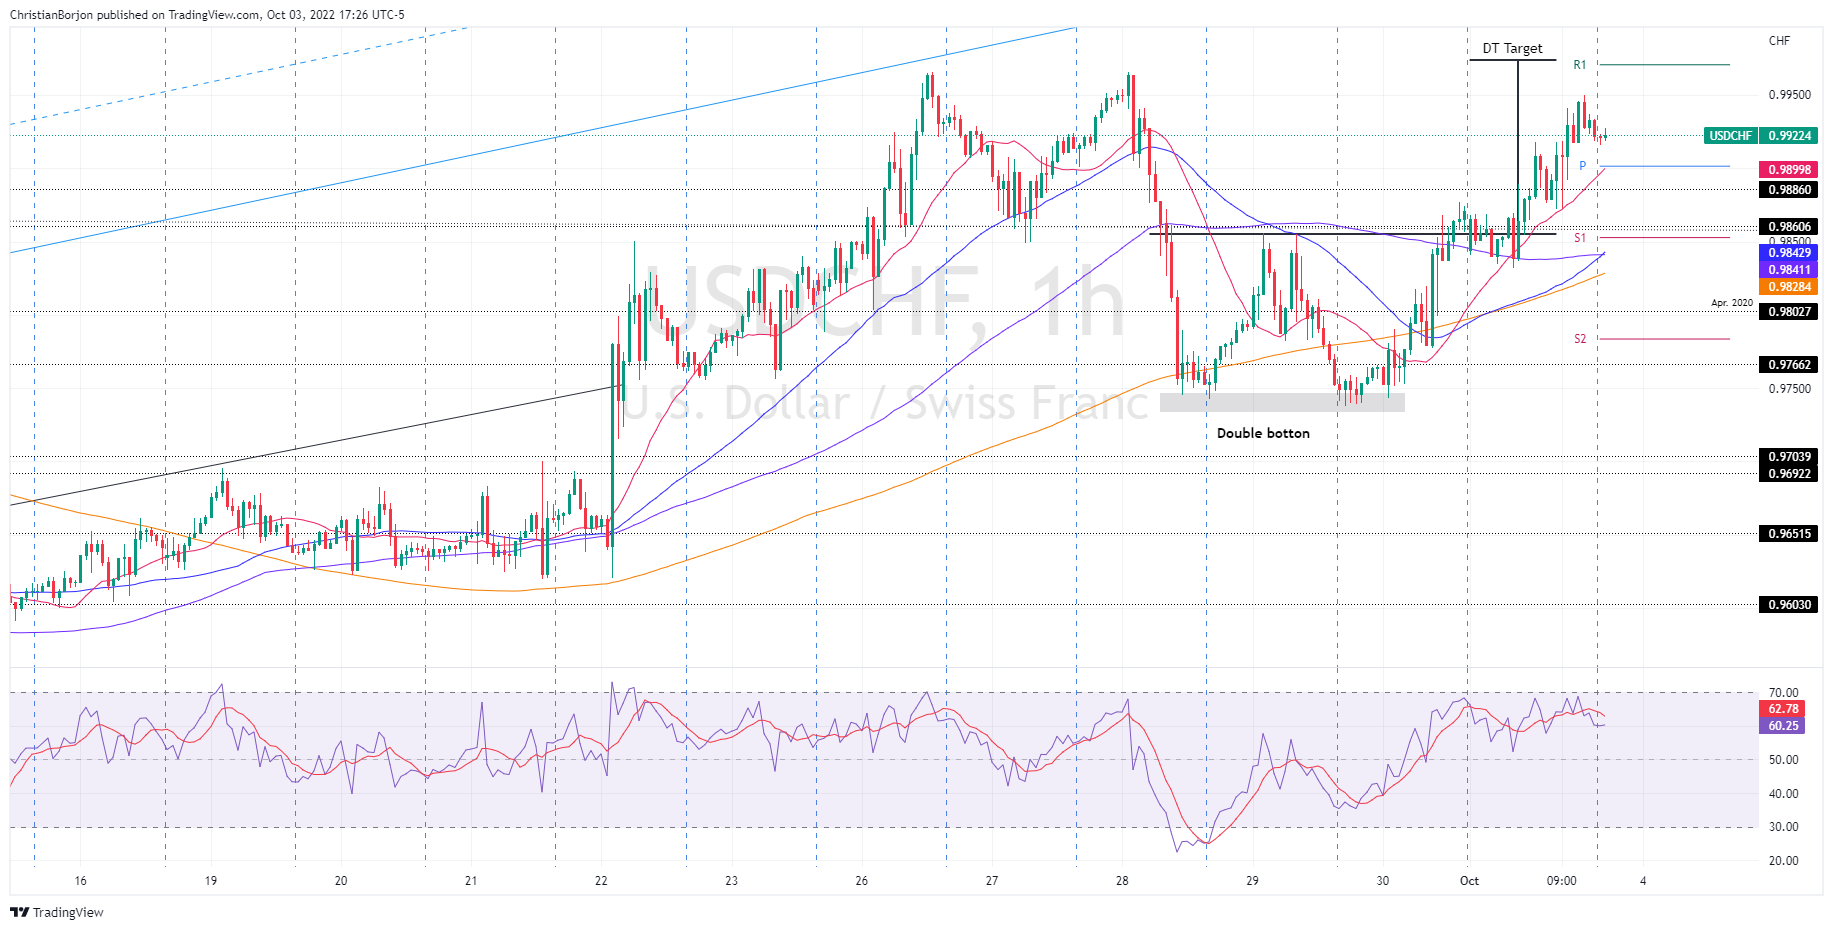
USD/CHF Price Analysis: Double bottom in the hourly chart, targets 0.9970s
- The USD/CHF reclaims 0.9900, as a double bottom chart pattern, targets 0.9974.
- Short term, the USD/CHF is neutral-to-downward biased, but it could reach the double bottom target before retracing towards the 20-EMA at 0.9899.
The USD/CHF is slightly down as the Asian Pacific session begins, though in the week it is gaining some 0.49%, after hitting a weekly high in the mid-0.99-1.00 range, due to improvement in sentiment; however, it retraced some to the current spot prices. At the time of writing, the USD/CHF is trading at 0.9922, down 0.01%.
USD/CHF Price Analysis: Technical outlook
From a daily chart perspective, the USD/CHF remains upward biased, though it failed to break above the September monthly high of 0.9966. It should be noted that the major has printed a higher low, but to continue its uptrend, it would need to clear September’s high to open the door for a parity re-test.
Since September 28, the USD/CHF bottomed around the 0.9740 area, forming a double bottom chart pattern. During Monday’s session, the USD/CHF decisively cleared the September 29 daily high at 0.9855, validating the pattern, which targets a rally towards 0.9974.
Therefore, the USD/CHF first resistance would be the October 3 high at 0.9966. Once cleared, the next resistance would be the double bottom target, at 0.9974, followed by the parity.
USD/CHF Key Technical Levels